
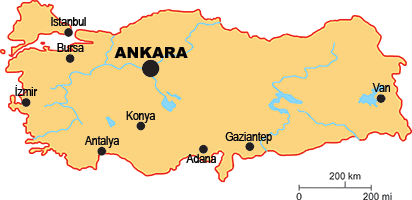
TÜRKIYE

Capital Ankara
Area (km2) 774 815
Total population (thousands, 2022) 84 980
Population density (per km2) 110
National currency New Turkish Lira (TRY)
National statistical office www.turkstat.gov.tr
Turkish Statistical Institute (TURKSTAT)
Population by age, 20220-45-910-1415-1920-2425-2930-3435-3940-4445-4950-5455-5960-6465-6970-7475-7980-8485-8990-9495-99 01000200030000100020003000Males50.1%Females49.9%Thousands
Women in the labour force, 2020
   percentage of total for both sexes 32%
Gender pay gap
   monthly earnings, 2018 8%
   hourly wage, 2018 3%
Women in part-time employment, 2023
   percentage of employed women 16%
Female tertiary students, 2019
   percentage of total for both sexes 48%
Female victims of homicide, 2021
   percentage of total for both sexes 22%
Women researchers, 2022
   percentage of total for both sexes 37%
Life expectancy at birth, 2019
   females, years 81.8
   males, years 76.4
Life expectancy at 65, 2019
   females, years 20.0
   males, years 16.6
Total fertility rate, 2019
   average number of children per woman 1.9
Adolescent fertility rate, 2020
   number of live births per 1000 women aged 15-19 15.0
Mean age of women at birth of first child, 2023
   age in years 27.1
18%47%43%13%12%82%53%58%87%89%0102030405060708090100ManagersProfessionalsClerical support workersCraft and relatedworkersPlant and machineoperators andassemblersWomen and men in selected occupation groups, 2020WomenMen
16-2425-5455-74020406080100Internet use by age and sex, 2021WomenMenAge% users over 3 months
47%20%53%80%94%0102030405060708090100Judges, 2019Members of parliament,2024Government ministers,2022Women and men in public lifeWomenMen
 
2018
2019
2020
2021
2022
2023
Employment
 (% change over previous year)
1.9
-2.3
-4.9
7.9
6.8
2.9
Unemployment rate
 (%)
10.9
13.7
13.2
12.0
10.5
9.4
Youth unemployment rate
 (%)
20.3
25.4
25.3
22.6
..
..
201820192020202120222023012345678910111213Real GDP growth rate3.0%0.8%1.9%11.4%5.5%5.1%
GDP
   current prices, millions of US dollars, PPP, 2022 3 182 087
GDP, per capita
   current prices, US dollars, PPP, 2022 37 445
Exports of goods and services
   % of GDP, 2023 31.9
Imports of goods and services
   % of GDP, 2023 34.4
Final consumption expenditure, per capita
   current prices, US dollars, PPP, 2022 25 823
Purchasing Power Parity (PPP)
   TRY per USD, US=1, 2022 4.718
15-1920-2425-2930-3435-3940-4445-4950-5455-5960-6465-6970+020406080100Economic activity rate, 2020, %WomenMen
201820192020202120222023202401020304050607080Consumer price index% change over previous year16.3%15.2%12.3%19.6%72.3%53.9%58.5%
Forest resources
   Area of forest
 (percentage of land area, 2015)
15
   Wood volume
 (m3 per inhabitant, 2015)
19
201520162017201820192020202120222023100120140160180200220GDP in agriculture, industry, services (2010 = 100)AgricultureIndustry (including construction)Services

value: 100%

sector:

value: 100%

sector:

7%GDPby major sectors, 2023AgricultureIndustry (including construction)Services32%GDPby major sectors, 2023AgricultureIndustry (including construction)Services61%GDPby major sectors, 2023AgricultureIndustry (including construction)Services15%Employmentin major sectors, 202328%Employmentin major sectors, 202358%Employmentin major sectors, 2023
Transport infrastructure, road accidents and traffic
   Railways
      total length in kilometres, 2022 10 651
   Motorways
      total length in kilometres, 2023 3 726
   Persons injured in road accidents
      per million inhabitants, 2021 3 264
   Persons killed in road accidents
      per million inhabitants, 2021 64
   Traffic, railways
      million passenger-kilometres, 2023 6 037
      million tonne-kilometres, 2023 13 108
   Traffic, roads
      million passenger-kilometres, 2023 380 178
      million tonne-kilometres, 2023 335 126
201620172018201920202021020406080100Persons killed in road accidents, per million inhabitants929282665864