EXPLORING EUROPEAN INLAND WATER FREIGHT WITH MAPS
VISUALISING TRANSPORT VOLUMES ON RIVERS AND CANALS
18-01-2023
Inland waterways provide a low-cost, low-carbon, safe transport option for freight movements in many key European corridors, taking lorries off the road network.
Let’s see the data for the main countries in Europe.
TOTAL INLAND WATER TONNAGE IN SELECTED EU COUNTRIES
The graph above (sourced from the UNECE database) shows that inland water traffic has been quite stable in recent years, with Germany and Belgium sometimes changing places as second place to the Netherlands.
But this doesn't show where the freight moves. Geospatial data are more useful to visualise volumes travelling between major industrial centres, and see the best way to shift further quantities from the road network, and possibly also integrate intermodal shipments with the rail network. This can improve road safety, decrease emissions and improve traffic conditions.
Geospatial data are also useful when considering the environmental impacts of inland transport itself, e.g. when combined with pollution data from satellite images.
So how can we produce a map of inland waterway freight volumes, without collecting new data? Eurostat produce origin-destination data the between sub-national regions (based on the NUTS2 classification) for EU countries (although data for Italy and Sweden are not currently reported). It is easy to plot these data as straight lines between the regions’ centroids. Let’s see this.
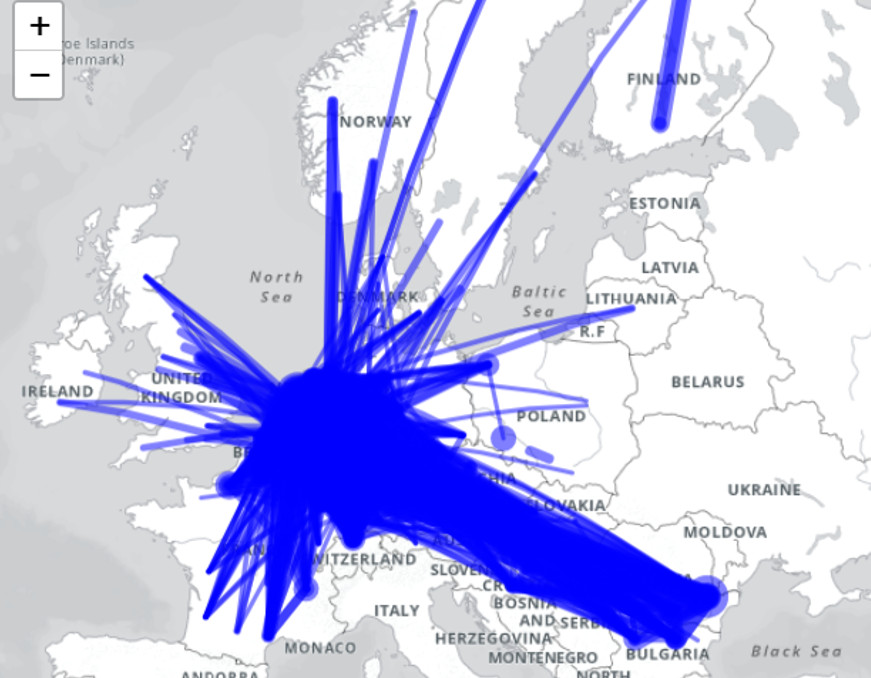
Plotting everything doesn’t show much. There’s too much noise, although this does highlight some of the key river-sea shipping flows. Let’s filter only the biggest volumes (pairs that have greater than 220kt of goods each year).
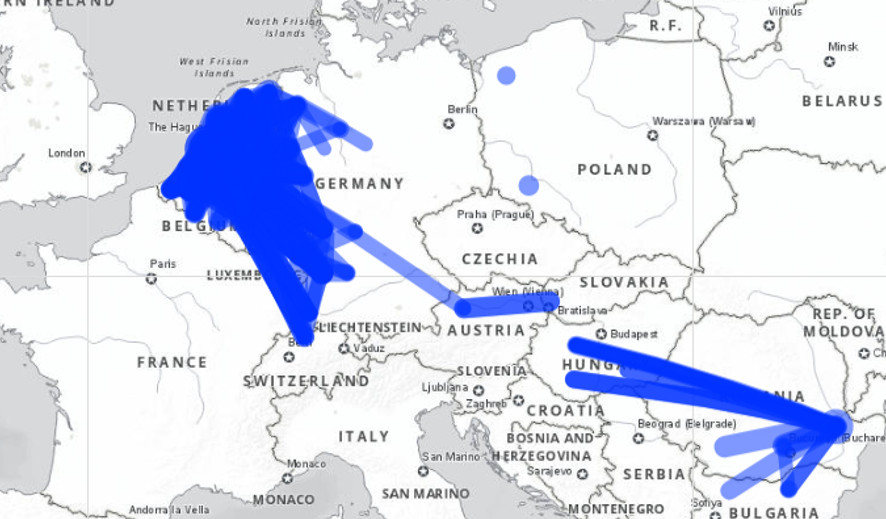
This shows us the importance of the Rhine and Danube rivers. But there’s not much further insight to be gained; the lines overlap each other and it is difficult to quantify differences between different regions.
Is there are a way to translate these straight lines onto the real shape of the waterway network, and sum them up, so that we can estimate tonnage on every waterway?
With data science tools, these straight lines can be projected onto the shapefile of the E Waterway network (the AGN, as available in the Blue book database).
This method will not be perfect, as the shortest path between region centroids will distort some journeys, and river-sea shipping quantities are likely to be distorted or not shown at all. But it is likely to give a good order-of-magnitude approximation for most routes of interest.
For a page describing the methodology in more detail, and its limits, please see here. Now let’s see the map.
The boundaries and names shown and the designations used on this map do not imply official endorsement or acceptance by the United Nations.
UNECE hopes that this interactive map is useful for policy makers in the inland water sector and beyond. But more can be done. Future maps may explore changes in transport volumes over time or changes by types of good. What do you think would be most useful?
Read more about our inland water policy work here.
Browse the interactive map here.
DO YOU LIKE THE ARTICLE?
Give us your opinion.