

Safely managed drinking water is defined as use of an improved source that is accessible on premises, available when needed and free from contamination. When the SDGs were established in 2015, many countries lacked data on the availability and quality of drinking water. Recent data collection efforts have highlighted the challenge of meeting SDG targets, especially in rural areas.
By 2020, five years into the SDG period, almost all countries in the UNECE region had estimates for basic drinking water services (improved source with collection time ≤30 minutes), but few had estimates for safely managed drinking water services (SDG indicator 6.1.1) in rural areas. While 48 countries had data on accessibility on premises, only 16 had data on availability when needed, and just 14 had data on whether rural water supplies were free from contamination.8
8 WHO/UNICEF JMP (2021) estimates for Uzbekistan did not include results from the 2021/2022 MICS survey.
Only 14 out of the 56 countries of the UNECE region had estimates for safely managed drinking water in rural areas in 2020.
Safely managed and basic drinking water services in rural areas in 2020, per cent of households covered

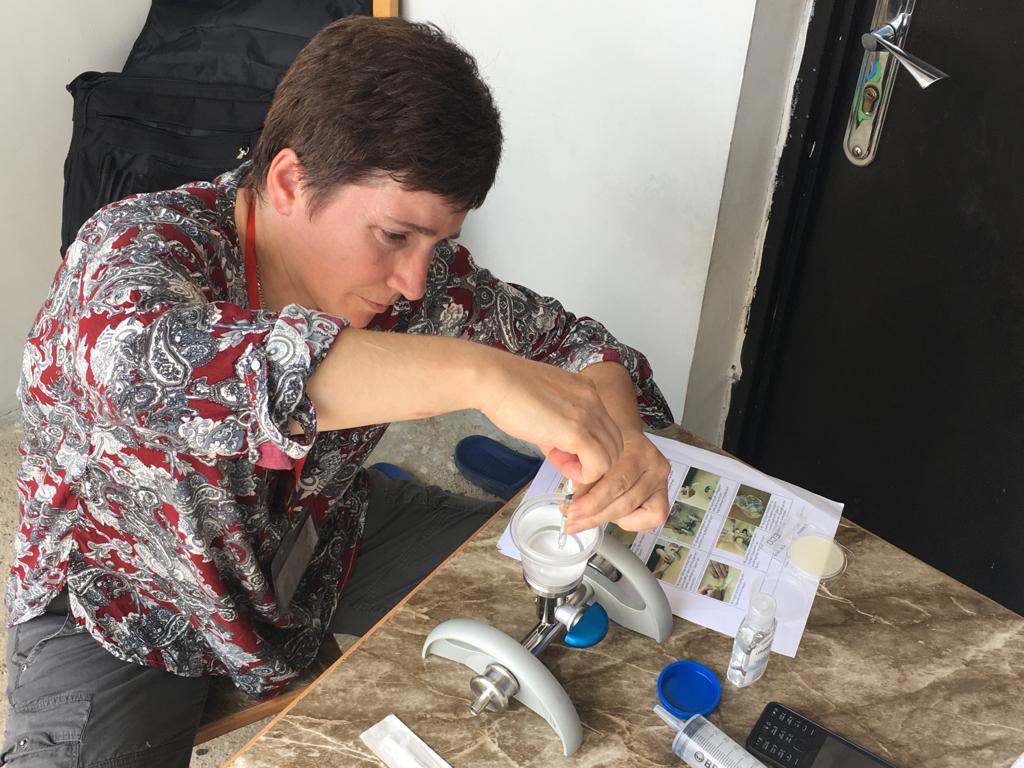
Data on the quality of drinking water are often only available for urban populations connected to piped networks. To address this data gap the WHO/UNICEF Joint Monitoring Programme (JMP) for Water Supply, Sanitation and Hygiene collaborated with UNICEF Multiple Indicator Cluster Survey (MICS) programme to develop a module for testing drinking water quality household surveys. The integration of water quality testing into national household surveys has enabled the collection of data representative of the entire population, including those in rural areas and those who are not served by utilities or covered by regulators. Since 2015 the module has been implemented in over 40 countries enabling many to report on SDG 6.1 for the first time.
At least basic water services in rural areas in 2020, per cent of households covered

For example, the water quality testing module was included in the 2018 MICS in Georgia. The survey found that while 97.5 per cent of the population used an improved drinking water source and 91.6 per cent were accessible on premises, just 77.5 per cent were available when needed and 75.1 per cent were free from faecal contamination (E. coli). Only 56.2 per cent of the population had drinking water services meeting all of the SDG criteria and coverage of safely managed drinking water was much higher in urban areas (70.3 per cent) than in rural areas (35.4 per cent). The survey also revealed significant disparities between sub-national
regions and socio-economic groups.
In 2020, only 10 countries in UNECE had sufficient data to estimate trends in rural coverage of safely managed drinking water and only 2 of them are on track to achieve universal access by 2030. Coverage ranged from 98 to 31 per cent and annual rates of change also varied widely. For example, Azerbaijan has increased rural coverage by 2.21 percentage points per year rising from 34 per cent in 2000 to 78 per cent in 2020. It is therefore on track to achieve universal coverage by 2030 (shown in blue). But the majority of countries are progressing too slowly (shown in yellow) and in some countries rural coverage has decreased (shown in
orange).
Rural progress towards universal access to safely managed drinking water services (2000–2020) among countries with less than 99 per cent rural coverage in 2020

United Nations Economic Commission for Europe
Palais des Nations, Geneva