


Water, sanitation, hygiene and health are key to the achievement of the 2030 Agenda for Sustainable Development. In addition to having a dedicated Goal with targets and indicators, they also relate to the achievement of almost all other SDG goals and targets, including in relation to poverty eradication, good health and well-being, gender equality and climate action.
The UNECE-WHO/Europe Protocol on Water and Health provides a framework that allows countries to set, monitor and regularly review intersectoral targets, accompanied by indicators and measures for implementation. Portugal integrated this framework with SDGs target setting processes, aligning its international commitments and attaining concrete advantages for measuring progress.
For instance, when setting a target on access to sanitation under the Protocol, Portugal aligned the indicator with that proposed for monitoring SDG target 6.2, as follows:
6.2.1.a “Proportion of population using safely managed sanitation services, including a hand-washing facility with soap and water”, using a proxy indicator based on EU statistics on income and living conditions; and
6.2.1.b “Proportion of dwellings served by wastewater drainage (%) by geographical location (NUTS, 2013)”, assuming that all households with service coverage through sewerage networks have safely managed sanitation services, including a handwashing facility with soap and water.
The data used for monitoring both the Protocol and SDG indicators is collected by the Portuguese Water and Waste Regulation Authority (ERSAR) based on the indicator “Percentage of households located in the utility’s intervention area with satisfactory evaluation in the indicator ‘AR01 – Service coverage through sewerage networks’”.
Furthermore, in 2016 Portugal included an additional indicator for the target set under the Protocol to cover on-site sanitation, namely: “d.2: Increasing the level of service coverage through controlled on-site systems”. Under this indicator, data is collected for cases where municipalities collect and safely dispose of wastewater from on-site sanitation systems. Cases where private operators manage the collection and disposal of wastewater are not covered by this indicator; however, the indicator increases understanding and supports
improving safely managed on-site sanitation systems.
Percentage of households located in the utility’s intervention area with satisfactory evaluation in the indicator ‘AR01 – Service coverage through sewerage networks’, Portugal, 2016–2021

Source: Portuguese Water and Waste Regulation Authority (ERSAR)
Photo credit: Portuguese Water and Waste
Regulation Authority (ERSAR).
The indicator presented, in general, a favourable evolution over the years. Although the indicator did not reach the target set for 2020, it should be noted that the analysis of its evolution should be complemented with the information reported under indicator “d.2: Increasing the level of service coverage through controlled on-site systems”, since access to sanitation
services can also be attained through mobile means. Indicator d.2 has shown an increasing trend since 2018, although with reduced percentages. Considering these results, in the new water strategic plan for the water and sanitation (PENSAARP 2030) and in the new generation of quality-of-service indicators (4th generation), the mobile services (septic tanks) are included in the revised indicator, which is now named “Physical accessibility of the service through fixed networks and mobile means”. Thus, the growing trend in recent years confirms the improvement of safely managed on-site sanitation systems.
In addition, Portugal is collecting data on the affordability of water, sanitation and solid waste services, based on affordability indicators. The water affordability indicator is defined as the (weighted) average charge for the consumption of 120 m3 per year in a water and sanitation system’s service area divided by the average disposable household income in that service area. Affordability is considered good when the average bill for a service represents less than 0.5 per cent of average household income, average when it is between 0.5 and 1 per cent, and poor when it more than 1 per cent of average household income. When looking at the national level, water provision is classified as having a consistently good level of affordability over the last five years, but this masks geographical differences in affordability. A more fine-grained analysis, applying the indicator at the service area level, shows that for several service areas the affordability of water provision is only average.
Affordability for drinking water supply at the national level in Portugal, 2017–2021

Source: Portuguese Water and Waste Regulation Authority (ERSAR)
Geographical disparities in the affordability indicator for drinking water supply in Portugal
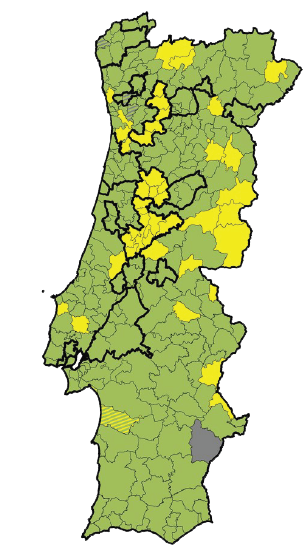

Source: Portuguese Water and Waste Regulation Authority (ERSAR)
ERSAR has included the affordability indicators in its annual sector report since 2011 and it also included them in the National Strategic Plan for the Water and Sanitation Sector for the period from 2014 to 2020 (PENSAAR 2020). The findings of the affordability indicators can be used to inform the work of service providers, municipalities and ERSAR, particularly as future tariff reforms progressively catch up with the fact that a number of service providers do not yet invoice some of the services or bill them below the cost of provision. In 2021, the affordability indicator was revised to include other factors not previously included (e.g. some taxes) and an additional indicator for social tariffs is also included in this new generation of indicators (4th generation). Furthermore, ERSAR’s recommendation on social tariffs (from 2018) was revised during 2022, aiming to promote a discussion on the criteria for a harmonised implementation of social tariffs.
United Nations Economic Commission for Europe
Palais des Nations, Geneva