





Chapter 3 Use of mirror statistics

73.
73. Mirror statistics involves using immigration data from destination countries to estimate emigration figures from origin countries. Indeed, immigration statistics are often considered more reliable than emigration statistics for several reasons. In countries relying on traditional data sources such as field-based censuses or surveys, measuring emigration is particularly challenging since emigrants are absent from the country during data collection. This makes it necessary to rely on proxy questions asked of households about absent members, a limitation not faced in collecting immigration statistics. Furthermore, in countries using administrative or register-based data sources, migrants typically have stronger incentives to register in their destination country than in deregistering from their country of origin. In addition, countries themselves often have stronger motivation to monitor and support people within their borders (immigrants) than those outside their borders (emigrants).
74.
74. High-quality immigration statistics by various breakdowns (e.g. country of previous residence, age, sex) are increasingly available in many countries, providing an underutilised potential to improve emigration measurement.
75.
75. Integrating mirror statistics into an annual statistical production process and publication schedule can be challenging for NSOs. Several barriers contribute to this underutilisation, such as inconsistencies in migration definitions and duration of stay across countries, as well as variations in data sources and discrepancies in the timing of event recording between origin and destination countries (UNECE and Eurostat, 20105). Additionally, some estimates rely on proxies, such as country of birth or citizenship, instead of previous residence and there are further difficulties with capturing individuals with dual citizenship. The issue of conceptual differences is often a barrier for countries trying to use mirror statistics, as methods cannot be easily harmonised. The absence of robust data-sharing frameworks further limits access and the effective use of mirror statistics.
76.
76. The conclusions and recommendations in this section rely on the responses from 11 countries to the questionnaire, therefore a limited sample cannot be considered representative of global practices.
 3.1 Responses to the questionnaire
77.
77. This section summarises the experience and interest of the task force members in using mirror statistics to estimate emigration or to evaluate estimates of emigration. It covers how countries use mirror statistics, which other countries they collaborate with, and their interest in using mirror statistics or sharing their own data to facilitate the use of mirror statistics in other countries in the future.
3.1.1 Experience using mirror statistics
78.
78. Of the 11 countries that participated in the questionnaire, 9 (Albania, Canada, Hungary, Italy, Latvia, Mexico, New Zealand, Poland and United States) use mirror statistics to estimate emigration or to evaluate estimates of emigration, while 2 countries do not (Australia and United Kingdom).
3.1.2 Use of mirror statistics
79.
79. Of the nine countries that use mirror statistics, two use them to estimate emigration, four use them only to evaluate estimates of emigration, and three use them for both estimating emigration and evaluating estimates of emigration (Table 6).
80.
80. Latvia specified that mirror statistics are used to estimate emigration by country.
Table 6
Countries who use mirror statistics to estimate and evaluate emigration estimates
Countries who use mirror statistics to estimate and evaluate emigration estimates
|
Country
|
Use mirror statistics to estimate emigration
|
Use mirror statistics to evaluate estimates of emigration
|
|
Albania
|
x
|
x
|
|
Australia
|
|
|
|
Canada
|
x
|
x
|
|
Hungary
|
|
x
|
|
Italy
|
|
x
|
|
Latvia
|
x
|
|
|
Mexico
|
|
x
|
|
New Zealand
|
x
|
|
|
Poland
|
x
|
x
|
|
United Kingdom
|
|
|
|
United States
|
|
x
|
3.1.3 Working with other NSOs
81.
81. Eight countries provided information on the countries they work with or whose data they use as part of their use of mirror statistics (Table 7).
82.
82. More specifically, Canada uses data from the U.S. Department of Homeland Security to estimate emigration and uses data from the American Community Survey (ACS) from the U.S. Census Bureau to evaluate the estimates of emigration.
Table 7
Countries who work with or use data as part of their use of mirror statistics
Countries who work with or use data as part of their use of mirror statistics
|
Country
|
Data sources
|
|
Albania
|
ISTAT (Italy), Eurostat
|
|
Canada
|
U.S. Department of Homeland Security, U.S. Census Bureau
|
|
Hungary
|
Statistics Austria
|
|
Latvia
|
EU countries
|
|
Mexico
|
U.S. Census Bureau
|
|
New Zealand
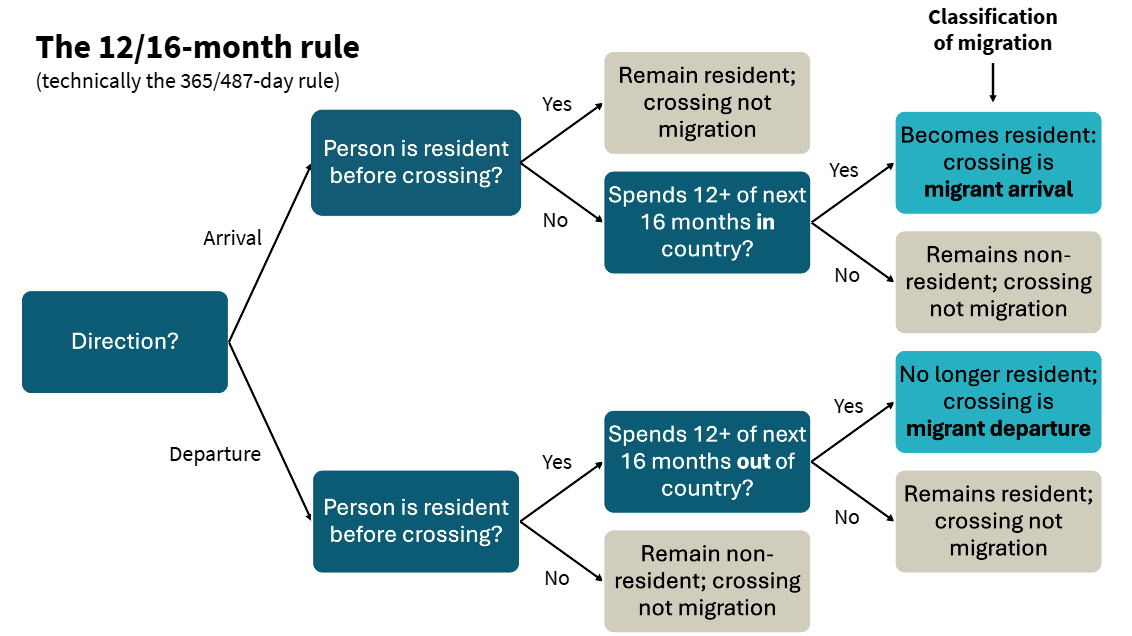
|
Australian Bureau of Statistics
|
|
Poland
|
European Countries
|
|
United States
|
Canada, Mexico
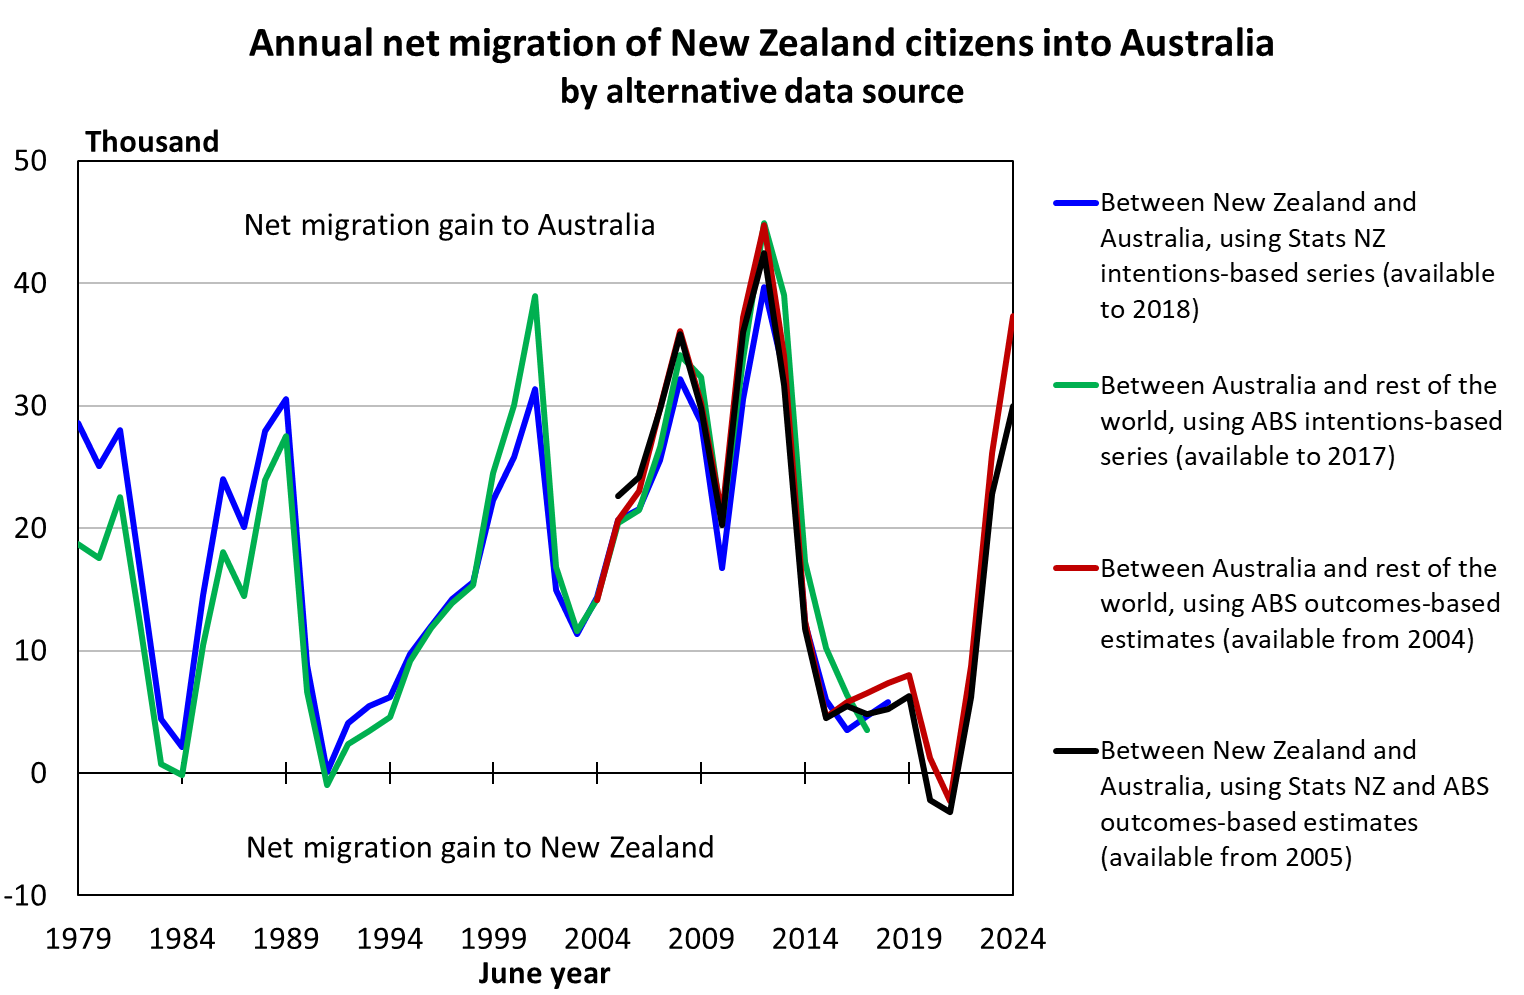
|
83.
83. Mexico evaluates the quality of the emigration statistics through a statistical evaluation process, which integrates the verification of data consistency and the detection of possible systematic errors with other external sources such as those collected in censuses and surveys of other countries, especially the United States (American Community Survey, ACS).
3.1.4 Estimating and evaluating estimates of emigration
84.
84. Ten out of eleven countries responded positively to the question regarding whether they have the ambition to use mirror statistics in the future to estimate or evaluate estimates of emigration.
3.1.5 Data sharing
85.
85. All ten countries that provided a response responded positively regarding whether they would be willing to share data with other countries to facilitate this work.
3.1.6 Insights on mirror statistics from other parts of the questionnaire
86.
86. Some insights into the use of mirror statistics can also be drawn from other parts of the questionnaire. In the questions on data sources and their relative importance, only three countries (Canada, Latvia and New Zealand) mention mirror statistics, all ranking it last in importance. Latvia also note that mirror statistics are used only when the country is unknown. This suggests that, even in countries that use mirror statistics, it often remains a secondary data source.
87.
87. New Zealand reports that they produce data by country of destination only for Australia, using mirror statistics. However, they also express an interest in producing estimates for other countries of destination, which highlights the interest in expanding the use of mirror statistics.
88.
88. In another section of the questionnaire, Poland notes that when comparing migration stocks and flows using mirror statistics, it becomes evident that emigration data for Poland is underestimated. This highlights the importance of mirror statistics to evaluate the quality of emigration statistics.
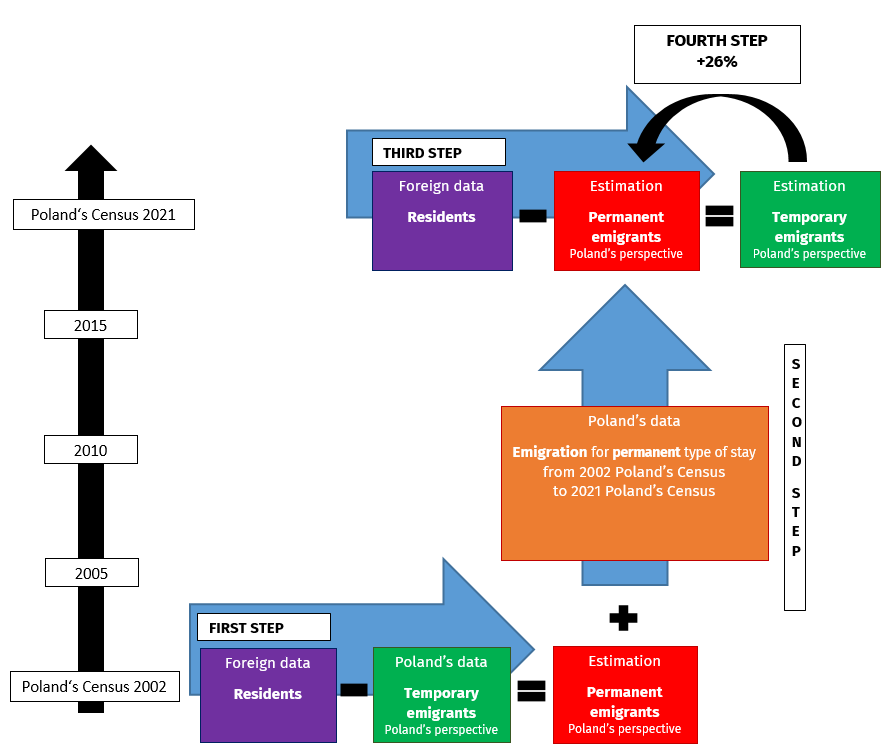
3.1.7 Reasons for not currently using mirror statistics
89.
89. The gap between the interest in using mirror statistics and their actual use deserves particular attention. For countries that express an ambition to use mirror statistics but have not yet done so, it is valuable to explore the specific reasons and barriers that limit their use. These may consist of the lack of international frameworks for data-sharing , including individual-level data, inconsistencies in definitions of international migration and duration of stay, and differences in data sources and methodologies across countries.
90.
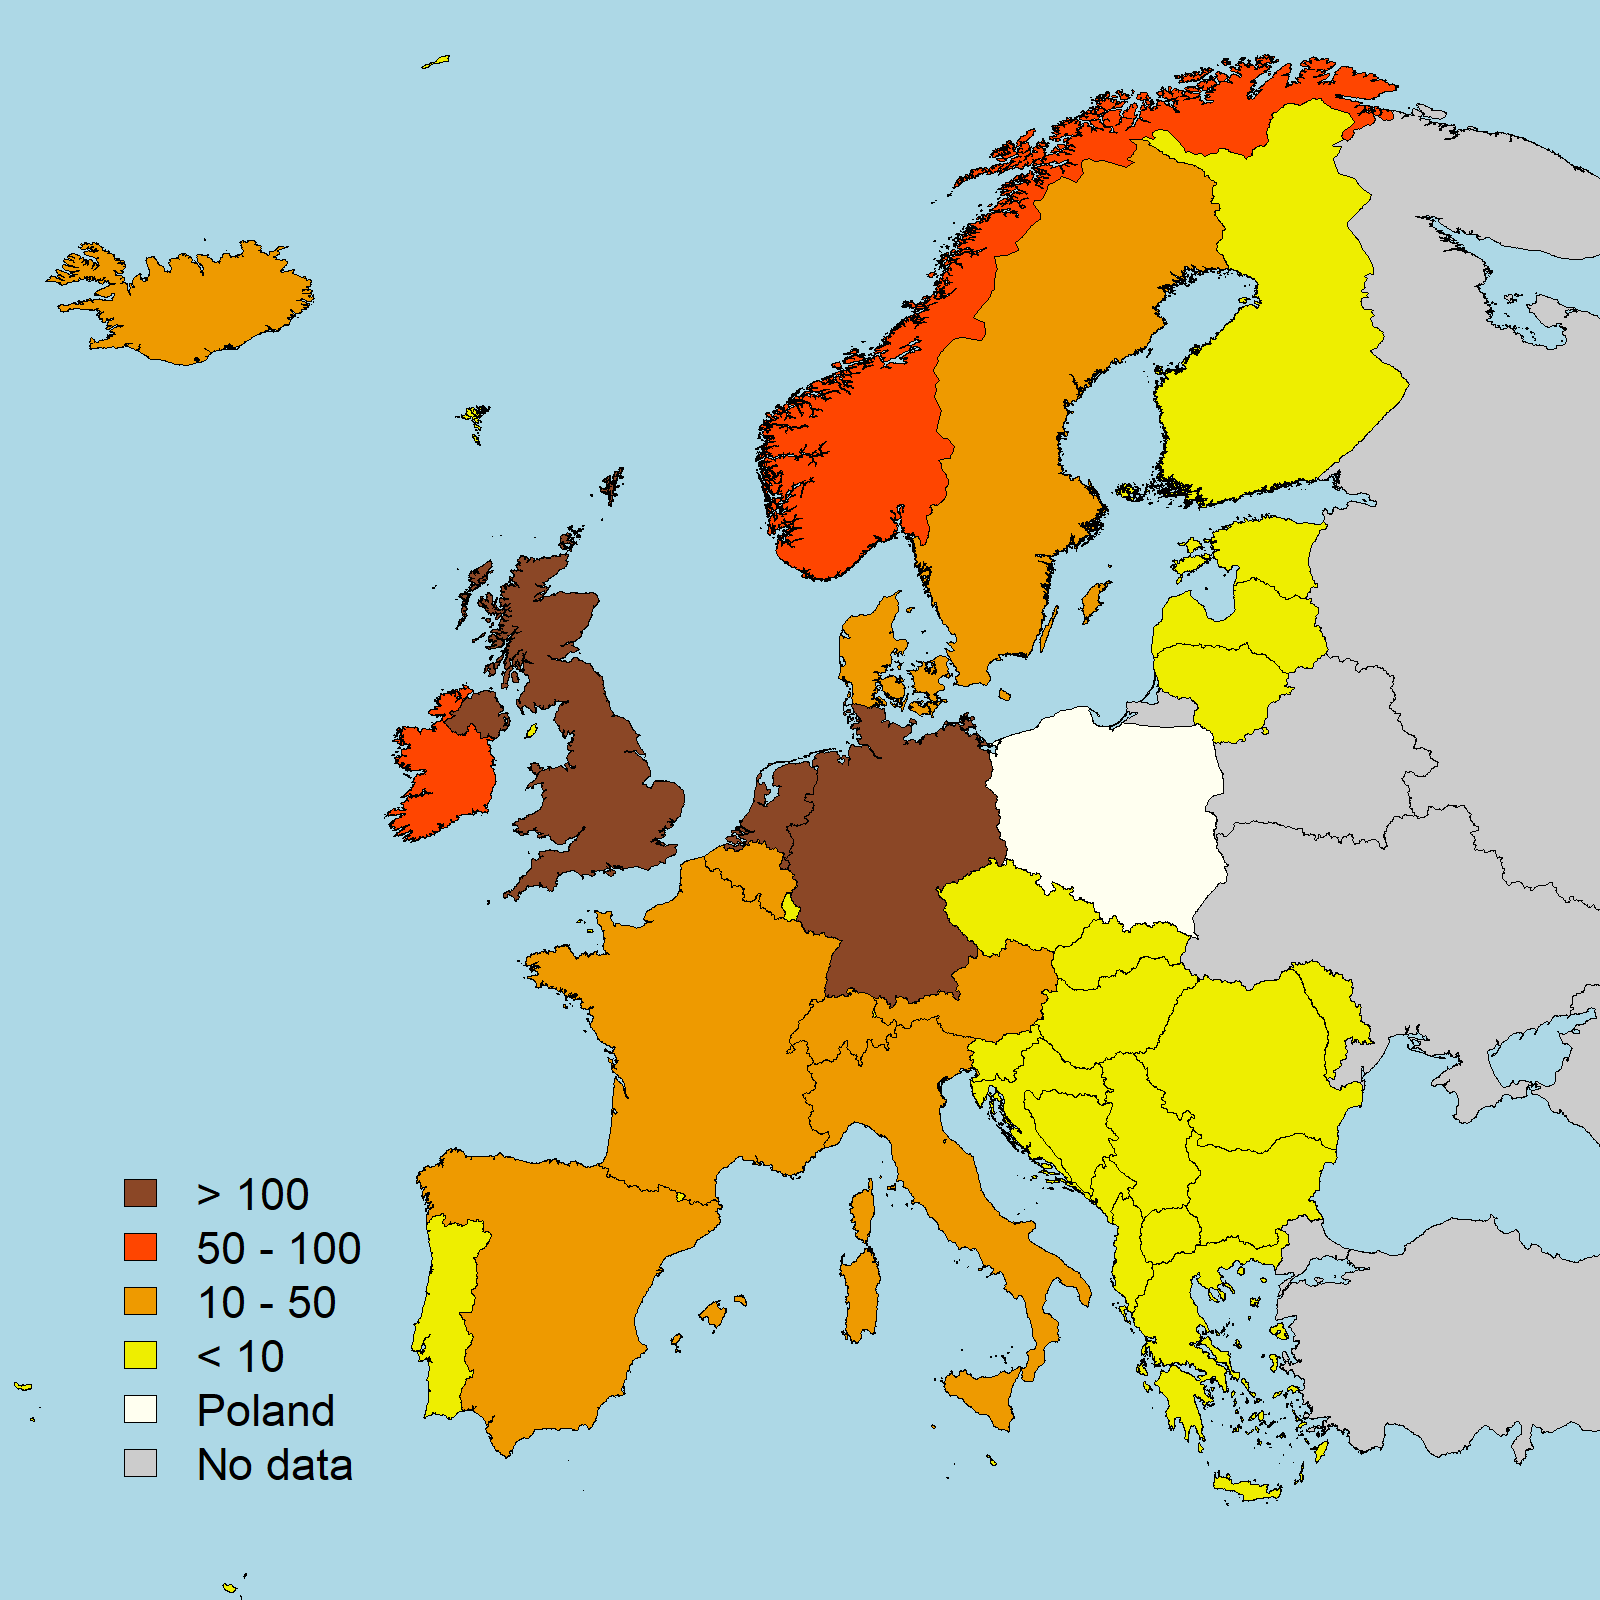
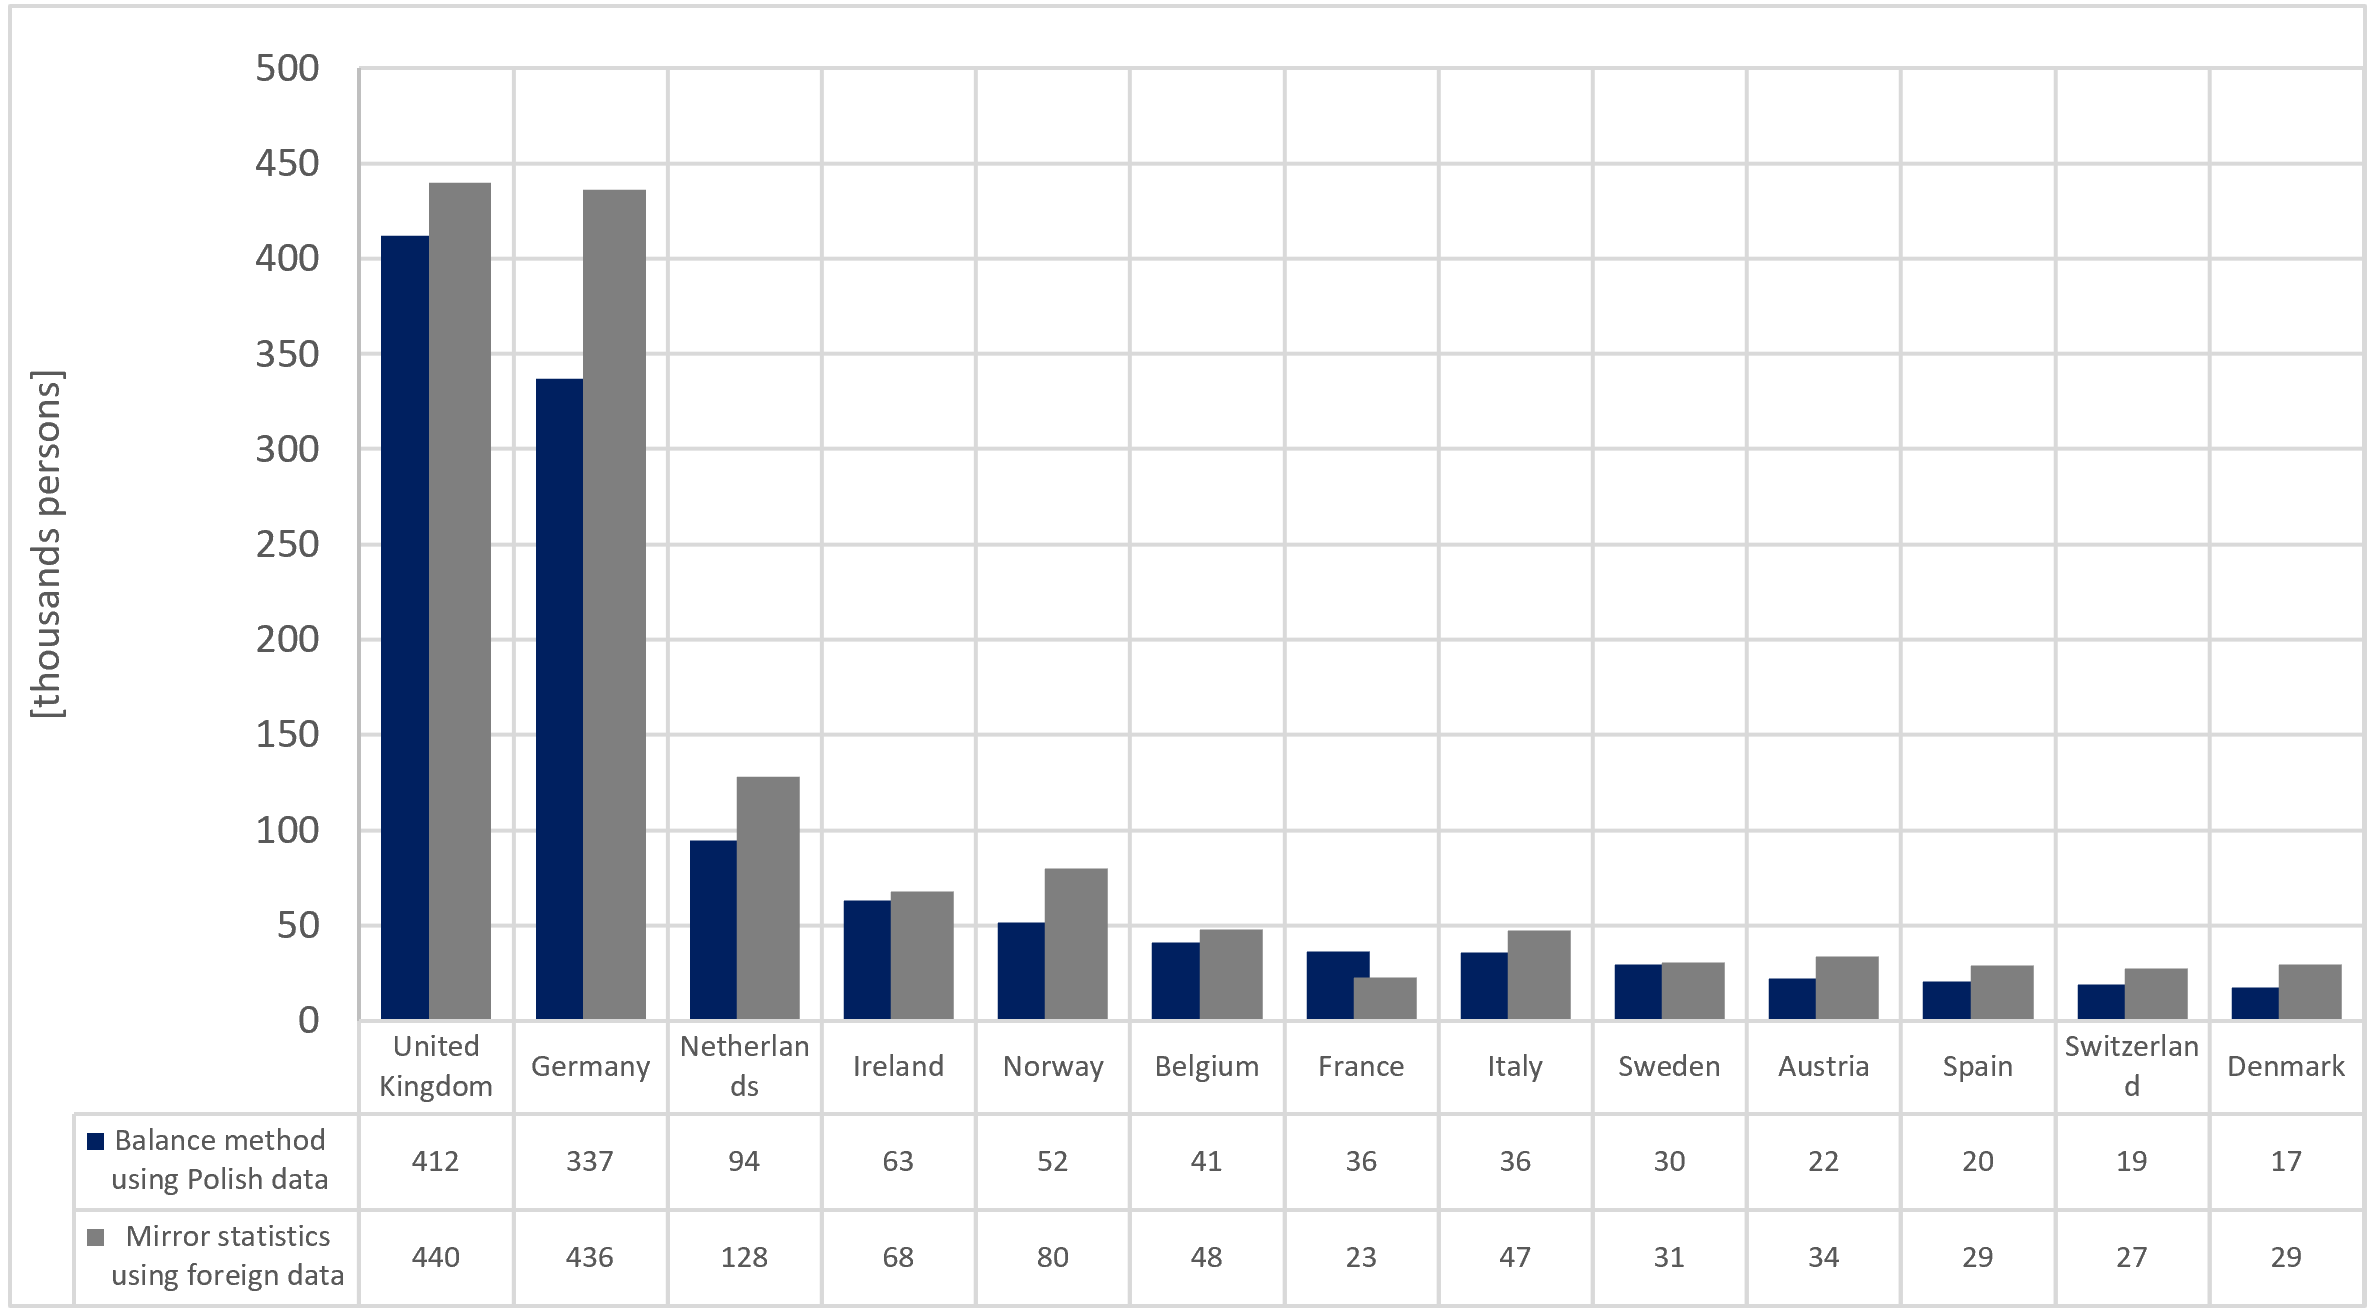
90. The United Kingdom lists as main reasons for not using mirror statistics the lack of coherence between different concepts and definitions used by countries, the different reference periods, and the different data collection processes and methods used by countries.
91.
91. Hungary identifies two primary reasons why they do not use mirror statistics to estimate emigration, which are that they are not available in time and they lack sufficient details. Furthermore, integrating mirror statistics into their current methodology is not straightforward.
92.
92. Concerning timeliness, Hungary explains that the data-producing and publishing system does not allow for annual retrospective revisions to be made to past data. Preliminary data are published in March and the final data in June, and new mirror statistics would not be available before then.
93.
93. Regarding the data breakdowns needed, Hungary’s migration data are based on administrative data sources. Because mirror statistics are not available at an individual level, they have not been built into the methodology. The additional methodological issue is that, due to the absence of a statistical population register in the Hungarian Central Statistical Office, immigration and emigration data are produced at the municipal level, and they are part of the official population change data at the municipal level. Unfortunately, mirror statistics are not available at the Hungarian municipal level.
94.
94. As a result, Hungary does not use mirror statistics to correct the data. Instead, a macro-level mirror statistics validation is used. Mirror statistics are received from Statistics Austria, since more than half of Hungarian emigrants move to Austria. This helps to verify the consistency of the data and consider the reasons for any inconsistencies, along with potential corrections.
95.
95. Finally, Hungary notes that if mirror statistics data were received at the individual level, they could be used in the current methodology. As this data is highly sensitive, it would be necessary to enter into a data exchange agreement that is firmly grounded in legal principles to obtain individual-level data.
3.2 Discussion of responses on mirror statistics and conclusion
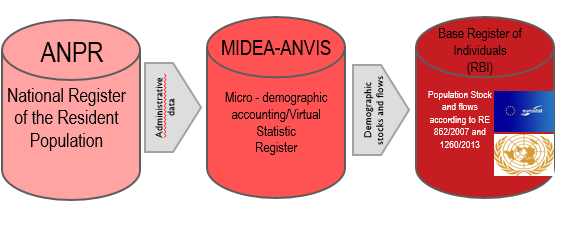
96.
96. The responses reveal both significant interest in and recognition of the potential value of mirror statistics. Of the eleven countries that responded to the questionnaire, eight currently use mirror statistics, and ten have expressed an ambition to use them in the future to estimate or evaluate emigration statistics. Furthermore, all countries that responded to the question have indicated a willingness to share data with other countries to facilitate this work.
97.
97. The first takeaway is therefore that there is a broad interest in expanding the use of mirror statistics to improve or evaluate their emigration statistics and to share their data with other statistical offices, fostering the broader application of mirror statistics in other countries.
98.
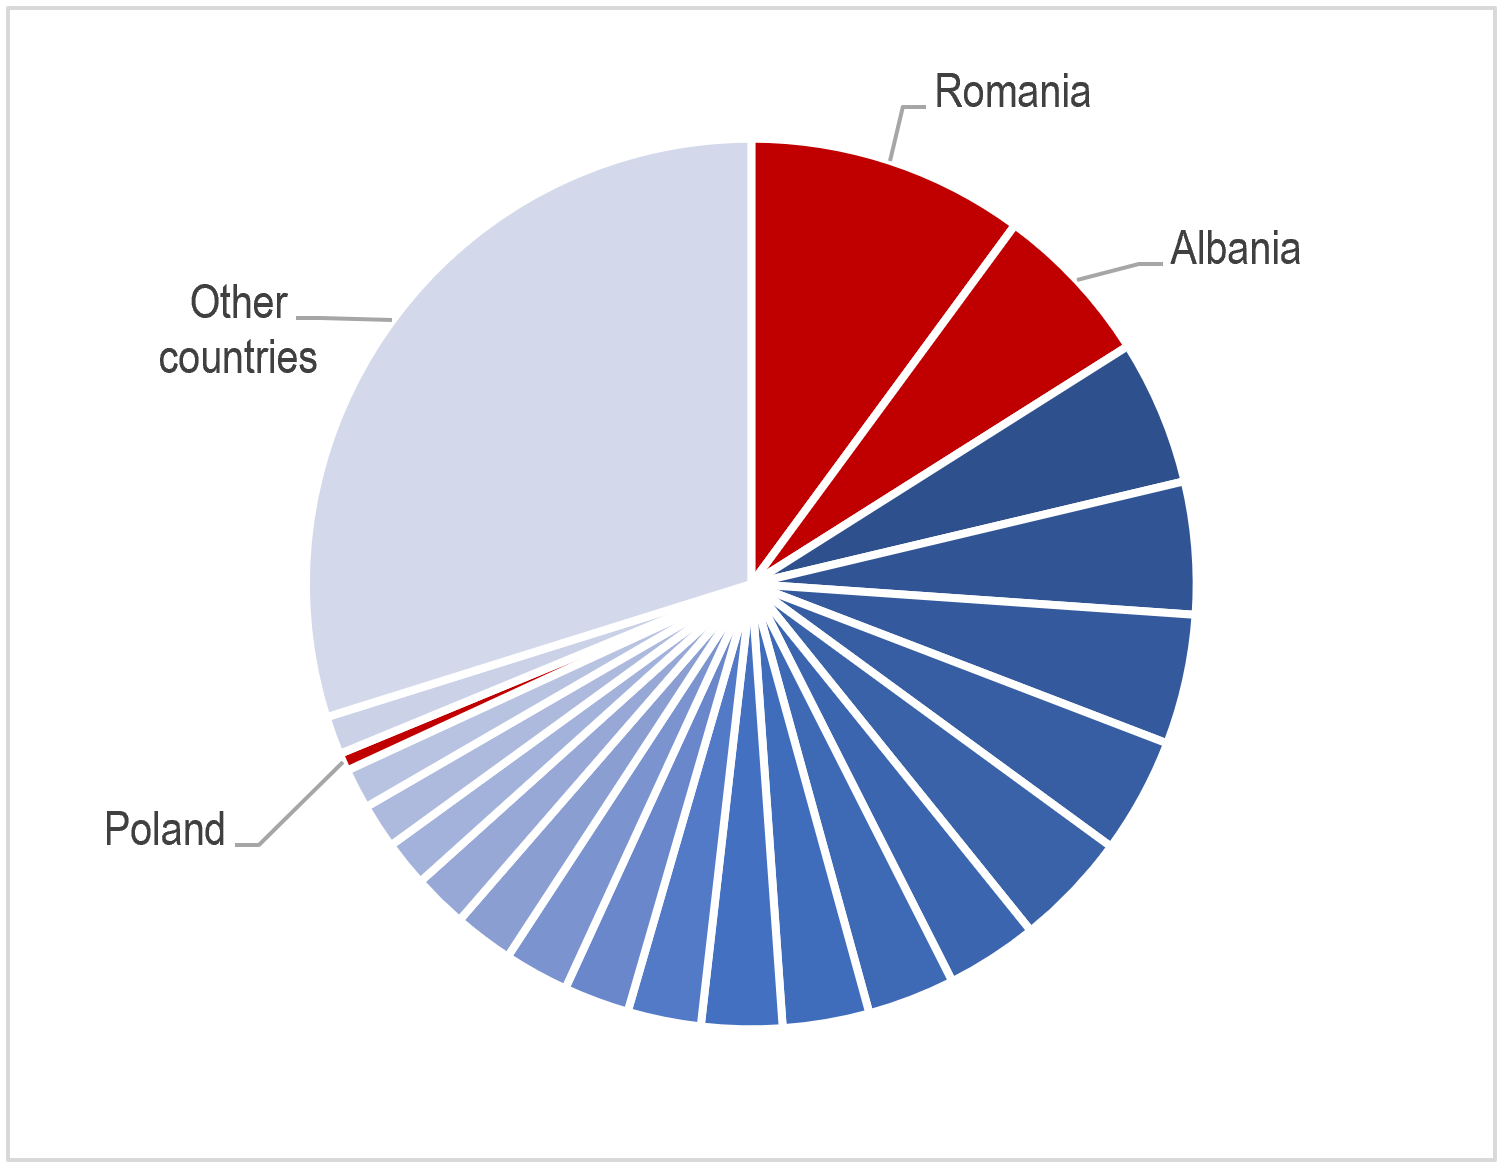
98. Another interesting finding is that all countries currently using mirror statistics collect data only from countries or international organisations within their own geographical region. Indeed, Canada, Mexico and the United States exchange data between themselves; New Zealand takes data from Australia; and Albania, Hungary, Latvia and Poland take data from European countries. While it is true that most emigration flows often occur with neighbouring countries or those within the same geographical region, migration is a global phenomenon. This highlights the need to establish connections between countries in different regions to facilitate data exchanges and promote the broader use of mirror statistics. Indeed, it may be more challenging for countries to establish collaborations to exchange data with countries from a different region of the world. Achieving this would therefore likely require a global framework for sharing detailed migration flows data.
99.
99. Another takeaway is that increased harmonisation of definitions and methodologies across countries would be very beneficial in facilitating the use of mirror statistics. This includes the population definitions used, the duration of stay criteria applied, and the identification of the date of migration.
100.
100. At the same time, the availability of more granular data would also facilitate the incorporation of mirror statistics in the data production of national statistical offices. Additionally, the sharing of individual-level data, in line with national legislation on data sharing and privacy, would make it easier for countries to use mirror statistics.
101.
101. In conclusion, the findings reveal a strong and increasing interest in the use of mirror statistics. A global initiative to support data exchanges between countries, along with further international alignment of migration flows definitions and data sources, may address some of the challenges related to the use of mirror statistics, and facilitate their use.
3.3 Recommendations and guidelines for using mirror statistics to produce, improve or evaluate estimates of emigration
102.
102. Given the strong interest in using mirror statistics, this section outlines a concise set of guidelines for countries looking to begin or expand their use.
103.
103. The first step is to define the objectives for using mirror statistics. They typically fall into one of three categories:
(a) To evaluate the quality of the emigration statistics produced;
(b) To improve the accuracy, coverage and granularity of the emigration statistics produced;
(c) To start producing emigration statistics.
104.
104. Countries that already produce emigration statistics may decide to use mirror statistics if comparisons reveal substantial differences. Mirror statistics may also be used to improve estimates of migration and population stocks.
105.
105. The next step is to identify destination countries of emigrants from which to collect mirror statistics. It is recommended to begin with countries that are primary destinations for emigrants.
106.
106. Identify available immigration data sources for each destination country. This may include data from national statistical offices, international organisations, research institutions and innovative data sources.
107.
107. For each data source, determine the granularity of available data, including breakdowns by country of previous residence, age, sex, country of birth, country of citizenship and time of the immigration event.
108.
108. A crucial step is to examine the metadata of the data sources available to understand differences in definitions and coverage between national and mirror data sources. Key factors to assess include:
(a) Data sources used (e.g. administrative or register data sources, censuses, household sample surveys, border sample survey);
(b) Duration of stay criteria and whether this is based on intended or actual duration of stay;
(c) Population definitions (e.g. usual resident population, registered population, legal population etc.);
(d) Reference time and timing of event recording;
(e) Coverage and accuracy (e.g. inclusion of asylum seekers, refugees, irregular and undocumented migrants).
109.
109. Based on this assessment, evaluate the degree of comparability between mirror data and national data. Determine whether mirror data can be directly integrated, or if adjustments or partial incorporation are more appropriate.
110.
110. If emigration statistics are already produced, compare your figures to the corresponding immigration statistics from destination countries. This analysis should also be done across available demographic breakdowns.
111.
111. If no significant discrepancies are found, the comparison may simply be repeated during the next data production cycle, to evaluate if new discrepancies have arisen. However, such alignment is uncommon unless bilateral data exchanges are already in place. If there are significant differences, or if emigration estimates are not currently produced, the next steps focus on the incorporation of mirror data in the data production system.
112.
112. If useful, it can be considered moving from accessing public data to implementing data exchange frameworks with destination countries of emigrants. Establishing direct data exchanges with other national statistical offices, potentially with support from regional or international organisations, can improve timeliness of mirror data availability and data granularity, subject to national legal frameworks. Additionally, agreements to share individual-level data for the purpose of improving the measurement of migration flows can also be established, provided that they comply with national legislation on data protection and privacy.
113.
113. Develop a methodology to incorporate mirror statistics into the data production system. If emigration statistics already exist, two main approaches are possible:
114.
114. Fully replace emigration estimates when mirror statistics are available, depending on the country of destination of emigrants;
115.
115. Adjust and correct existing emigration estimates in line with the mirror statistics available.
116.
116. Countries may develop complex data integration methods to integrate mirror statistics in their data production system. More information on how data integration can improve international migration statistics and relevant examples of national practice can be found in a recent report of the United Nations Expert Group on Migration Statistics 6 and in the UNECE guidance on data integration for measuring migration7.
117.
117. Where mirror statistics do not cover all destination countries of emigrants or data breakdowns, proportional adjustment can be applied based on comparisons between national estimates and mirror data for available breakdowns. For countries without existing emigration estimates, it is especially important to source data from as many destination countries as possible.
118.
118. If population stocks are calculated using the demographic balancing equation, it is recommended that any corrections to emigration flows data are reflected in the population stocks estimates. Under-coverage of emigration flows can lead to over-estimation of population stocks, which can also lead to biased demographic indicators (Monti et al., 2020; Mussino et al., 20258).
119.
119. For countries relying on administrative or register data sources, it is also important to consider whether return migration is recorded for individuals who emigrated without notifying their departure. If this is not the case, mirror statistics may also help to improve immigration estimates by estimating returning nationals.
120.
120. Mirror statistics can also support the production of stocks of native or native-born populations resident abroad. Similar principles and limitations that apply to migration flows can be considered. Additionally, it is important to underline that many emigrants may naturalise in their destination country, and dual citizenships are often not reported in official statistics.
3.4 Recommendations and guidelines for supporting other countries in using mirror statistics
121.
121. National statistical offices can also support other national statistical offices’ efforts to improve emigration data by facilitating the use of their own immigration statistics. The production of high-quality immigration statistics by single country of previous residence and other data breakdowns is indeed crucial to support the use of mirror statistics by other countries.
122.
122. Therefore, it is essential that countries make full use of available data sources to produce immigration statistics with the most detailed demographic data breakdowns possible. . For a consistent application of mirror statistics, it is recommended that countries collect information on the last country of residence, in addition to country of birth.
123.
123. These data should also be made easily accessible and publicly available, with detailed metadata, to facilitate their use by other countries.
124.
124. Care and consideration should be taken to ensure that all data sharing adheres to Statistical Disclosure Control protocols.
125.
125. Metadata should clearly describe the definitions, sources, coverage and accuracy of the data produced, allowing other countries to assess their comparability and usefulness.
126.
126. If contacted by other national statistical offices, statistical offices are encouraged to share immigration statistics with the available breakdowns to enable timely use of mirror statistics. When data sharing platforms are available, national statistical offices may share their migration flows data, including provisional estimates, on such platforms as early as possible each year. If data-sharing frameworks are in place, data may also include additional data breakdowns or individual-level data not publicly disseminated due to confidentiality or other reasons.
127.
127. Finally, international and regional organisations have an important role in facilitating collaborations, supporting data sharing infrastructures, and promoting the use of mirror statistics globally.
128.
128. Developing legal frameworks for monitoring migration flows among countries of the EU and between other countries, including arrangements for the secure and legally compliant sharing of individual-level data, could be explored further as one possible avenue for improving the comparability and quality of migration statistics in the future.
3.5 Case studies
129.
129. The following three case studies from New Zealand, Poland and Italy provide practical insights into the use of mirror statistics.
130.
130. The first case study, from New Zealand, is an example on the use of mirror statistics to improve emigration flow statistics. This case illustrates a data exchange framework with the country where most emigrants migrate to, and with a high level of harmonisation of statistical definitions and concepts.
131.
131. The second case study, from Poland, shows how mirror statistics can improve estimates of nationals living abroad. It is a case where more data sources with varying degrees of definitions are used.
132.
132. The third case study, from Italy, offers the perspective of a data provider. It shows how countries can support efforts in improving global emigration estimates by producing and sharing detailed immigration statistics that can serve as mirror statistics for other countries.
3.5.1 Case study: New Zealand
133.
133. In this case study, the exchange of international migration data between Australia and New Zealand, specifically the Australian Bureau of Statistics (ABS) and Statistics New Zealand (Stats NZ), is presented as an example of mirror statistics.
3.5.1.1 Background
134.
134. For many decades, both countries used arrival and departure cards to measure both international travel (inbound and outbound short-term movements across the border) and international migration (changes in the country of residence). The identification of migrants was largely based on self-response (intentions-based migration measurement), aligned with a 12-month threshold.
135.
135. Each country’s arrival card remains an integral data source for measuring international travel, and for some attributes of international migrant arrivals (such as country of previous residence). Both countries are also digitising their arrival cards, with the New Zealand Traveller Declaration able to be completed digitally from mid-2023, and the Australia Travel Declaration developing from late 2024.
136.
136. Australia discontinued its departure card in June 2017, and New Zealand in November 2018. Removing the respective departure cards had no statistical benefits, but did align with wider government goals to streamline the departure process for travellers. For New Zealand, it also coincided with the development of a transparent and objective method for estimating migration (outcomes-based migration measurement), rather than relying on the stated intentions of travellers on passenger cards. As Australia was already using this outcomes-based method, this gave the two countries very close alignment of their international migration estimates.
3.5.1.2 Harmonious 12/16-month rule
137.
137. Official measures of migrant arrivals, migrant departures, and net migration in both countries now rely on the linking of arrivals and departures to measure precisely how long people spend in the country or elsewhere. Both countries use a 12/16-month rule to classify border crossings as short-term or long-term (Figure 1):
•
A migrant arrival is a resident of another country who arrives in the country and cumulatively spends 12 out of the next 16 months in the country;
•
A migrant departure is a resident who departs the country and cumulatively spends 12 out of the next 16 months out of the country.
138.
138. In both Australia and New Zealand, a resident is someone living in that country, irrespective of their citizenship or visa status. For example, New Zealand residents comprise both New Zealand citizens and non-New Zealand citizens.
Figure 1
The 12/16-month rule
The 12/16-month rule
Source: Statistics New Zealand.
139.
139. The 12/16-month rule is broadly consistent with international guidelines on measuring international migration. Importantly, both Australia and New Zealand experience significant numbers of travellers making repeat visits over a period of several years. For example, international students may spend 9 months in the country in each of several years, with the remaining 3 months of the year in other countries.
140.
140. The 12/16-month rule does not require a 12-month threshold to be reached in 12 consecutive months. It therefore enables people, such as international students, who spend most of the year in the country in successive years, to be counted as migrants and subsequently in official population estimates. This is preferable to such sub-populations not being counted in official statistics, given the implications for service provision, infrastructure, housing, and labour markets.
141.
141. The exact application of the 12/16-month rule is not identical between the two countries. However, they share a largely harmonious concept which makes mirror statistics feasible. This is underpinned by high quality and complete administrative data on virtually all arrivals and departures into and from each country (from and to the rest of the world).
3.5.1.3 Information gap
142.
142. Without a departure card, both countries have no immediate source of information on where migrant departures are going. From a policy perspective, this may seem unimportant. Migration policies are invariably focused on targeting, processing, and managing migrant arrivals. Few policies are focused on people living in other countries.
143.
143. However, a broader understanding of migration flows including migrant departures is important for understanding cyclic migration, return migration, and population dynamics including the implications for future population change. Moreover, policies aimed at attracting migrants to address labour market needs may also want to consider policies to retain people before they depart, especially if they are native citizens.
144.
144. Australian and New Zealand citizens enjoy virtually unrestricted travel between the two countries. However, the two countries and economies are unequal in size, with Australia’s population of 27.2 million at June 2024 about 5 times larger than New Zealand’s 5.3 million. This contributes to a historical imbalance in the respective trans-Tasman flows.
145.
145. Of migrants departing New Zealand from the 1980s, the proportion going to Australia (at least initially) ranged between about 35 and 65 percent. Moreover, of New Zealand citizen migrants departing New Zealand, the proportion going to Australia ranged between about 40 and 80 percent.
146.
146. Australia is therefore the single most important destination for migrants departing New Zealand. However, the converse does not apply, with less than 10 percent of migrants departing Australia heading to New Zealand in 2024 (based on mirror statistics). Many of the migrants that do depart Australia for New Zealand are return flows of New Zealand-born and/or New Zealand citizens.
147.
147. Where migrants departing New Zealand are going to, is of high public interest in New Zealand, particularly when these are New Zealand citizens (and mainly New Zealand-born). Their concentration in the young working ages (e.g., 18–30 years) can also heighten concerns around a so-called ‘brain drain’, although the rhetoric is not always evidence-based. Fluctuations in migrant departures of New Zealand citizens have a significant impact on New Zealand’s overall net migration balance.
3.5.1.4 Data sharing
148.
148. In the absence of a data source to inform the destination of migrant departures, where does one look? The answer can lie in the data of other countries.
149.
149. A harmonious migration concept between Australia and New Zealand is an important start. Migrants departing New Zealand for Australia can be assumed to equate to migrants arriving in Australia from New Zealand. When both countries operated departure cards, there was general consistency between the intentions-based net migration statistics (Figure 2), notwithstanding inevitable differences in self-reported travel intentions. With the implementation of outcomes-based migration estimates, there is evidence of continued general consistency. (Published ABS data of net migration of New Zealand citizens is not by country of next/previous residence, although most of these migrant arrivals and migrant departures will be between Australia and New Zealand).
Figure 2
Annual net migration of New Zealand citizens into Australia by alternative data source
Annual net migration of New Zealand citizens into Australia by alternative data source
Source: Drawn by the author based on data from Statistics New Zealand and the Australian Bureau of Statistics.
150.
150. But data sharing agreements do not happen in a vacuum. They are easier to implement on the back of collegial working relationships built up over many years. This is true of the ABS-Stats NZ relationship, with frequent and open exchange of information, ideas, and data at multiple levels of the organisations.
151.
151. Stats NZ also did not seek access to unit record level. It is not necessary to track the longitudinal migration history of individuals beyond the New Zealand borders, as interesting as this may be from a labour market or demographic perspective.
152.
152. Aggregate macro-level data is sufficient to fill the immediate information gap of knowing how many migrants are departing for Australia (and by subtraction, to the rest of the world), and some limited attributes of the migrants. These attributes are citizenship (New Zealand, non-New Zealand), country of birth (New Zealand, non-New Zealand), and country of previous residence (New Zealand, not specified). Stats NZ makes a simple allowance for country of previous residence ‘not specified’ in both the Australian and New Zealand migrant arrivals data before publishing the Australian data (Infoshare: Estimated migrant arrivals to Australia by CLPR, citizenship and birthplace) and deriving estimates of net migration with Australia (see ‘Migration with Australia’ section in the monthly International migration release).
3.5.1.5 Differences in measurement
153.
153. Despite the harmonious migration concept used, there are some differences in data granularity between the two countries.
154.
154. First, the Australian migration estimates are published quarterly with quarterly granularity, while the New Zealand estimates are published monthly with monthly granularity.
155.
155. Second, the initial Australian migration estimates are published about 5½ months after the reference quarter, while the New Zealand estimates are published about 1½ months after the reference month.
156.
156. This does mean the Australian migration estimates lag the New Zealand estimates by several months. This does require some explanation in the Stats NZ dissemination of the combined data. For example, initial reporting of New Zealand’s December 2024 overall migration (including arrivals from Australia) is available in mid-February 2025, but initial reporting of New Zealand’s December 2024 migration with Australia (including departures to Australia and net migration with Australia) is not available until late June 2025.
157.
157. Finally, there is no independent verification available of the mirror statistics. When both countries operated departure cards, departures from one country to the other could be compared with arrivals from one country to the other.
3.5.1.6 Summary
158.
158. The exchange of aggregate migration data between Australia and New Zealand provides official statistics on the destination of migrant departures, especially from a New Zealand perspective.
159.
159. There are opportunities for data sharing and mirror statistics bilaterally and multilaterally. What makes this possible in the Australia and New Zealand case study are:
(a) Harmonious migration measures (using a 12/16-month rule) underpinned by high quality and complete administrative data on arrivals and departures in both countries;
(b) Collegial working relationships between the respective national statistical agencies at multiple levels;
(c) Use of macro-level (aggregate) estimates rather than unit record level data.
3.5.2 Case study: Poland
3.5.2.1 Definitions
160.
160. In this section, the term “temporary emigrant” refers to person who stay abroad or are willing to stay abroad for longer than 12 months while retaining a permanent address of a resident in Poland. The term “permanent emigrant” refers to person who have officially deregistered from permanent residency in Poland, becoming a resident of a foreign country. Every time when terms “temporary” and “permanent” are used in this section it refers to Polish perspective, informing about deregistration or maintaining a permanent address in Poland. Furthermore, temporary emigrants are still enumerated in Polish Censuses, while permanent emigrants aren’t.
3.5.2.2 Introduction
161.
161. The analysis aimed to provide methods and results of estimations on temporary emigrants with Polish citizenship for selected European countries. These are emigrants who usually maintain connections like paying remittances, and still have a reasonably high probability of returning to the country of origin. Statistics on temporary emigrants are published on the Statistics Poland website and are used, for example, by financial institutions in Poland, but also played a key role in quality assessing the 2021 Census in terms of measuring emigrants with Polish citizenship.
162.
162. Traditionally, mirror statistics are used for analyzing flows by comparing emigration numbers from the origin country with immigration numbers from the receiving country. In this case study, the approach is different – the mirror statistics method is applied to stock data.
163.
163. The application of mirror statistics to stock data is challenging. This is because the receiving country traditionally measures (e.g. in the national census) the stock of people by citizenship, according to the definition of the resident population. This definition includes both types of stay/absence: permanent and temporary (at least 12 months). The Polish census counts temporary emigrants, but does not try to count people who have officially deregistered from permanent residence in Poland. Conversely, the deregistered population should be included in the number of residents reported by the receiving countries.
3.5.2.3 Methodology
164.
164. Numerous data sources (Table 8) were used to estimate the number of Polish residents temporarily staying abroad for at least 12 months.
Table 8
Data sources
Data sources
|
Data Sources
|
Descriptions
|
|
Statistics Poland, the 2021 Census
|
Emigrants for a temporary residence for at least 12 months
|
|
Statistics Poland, the 2002 Census
|
Emigrants for a temporary residence for at least 12 months
|
|
Statistics Poland
|
Emigration for permanent residence (2002 to 2021)
|
|
Eurostat
|
Results from censuses round 2001 in Europe
|
|
Eurostat
|
Results from censuses round 2021 in Europe
|
|
National Statistical Institutes
|
Residents with Polish citizenship
|
|
UK’s Office for National Statistics
|
Data on immigration and emigration to/from EU countries aggregates; visa data
|
|
The Migration Observatory at the University of Oxford
|
165.
165. To apply mirror statistics, it was necessary to develop an algorithm to estimate the total distribution of temporary immigrants among residents with Polish citizenship reported by selected European countries at the critical moment of the 2021 Census in Poland (31 March 2021). The number of temporary immigrants with Polish citizenship in a given country was estimated by multiplying the total distribution by the number of residents with Polish citizenship reported by foreign statistical offices in subsequent years.
(a) In the first step, the initial stock (at the critical moment of the 2002 Census in Poland9) of emigrants with Polish citizenship with permanent type of stay was determined. For this purpose, the number (for the given country) of Polish emigrants with temporary residence determined in the 2002 Poland’s Census was subtracted from the appropriate number of residents with Polish citizenship reported by the given country;
(b) The minimum number of emigrants from Poland with permanent residence (at the critical moment of the 2021 Census in Poland – 31 March 2021) was estimated by adding to the initial stock (point a) the summed amounts for subsequent years (2002–2021) of permanent emigrations, i.e. those who deregistered from Poland with the intention of permanent residence abroad (official Polish administrative data). Return immigrations to Poland was not taken into account due to the assumption that the reported emigrations is underestimated. Therefore, there is no point in further reducing these numbers with returns;
(c) In the third step, the stock (at the critical moment of the 2021 Census) of Polish emigrants with temporary stay was calculated. For this purpose, the previously estimated minimum number of emigrants with Polish citizenship with permanent residence (point b) was subtracted from the appropriate number of residents with Polish citizenship reported by the given country;
(d) A correction for underestimation of permanent residents with Polish citizenship was introduced. The correction resulted in an increase in permanent emigrants (calculated in point b) by reducing (26%) number of temporary emigrants (calculated in point c) for all analyzed countries. The size of this correction was estimated based on the Migration Observatory at the University of Oxford publication: Permanent or Temporary: How long do Migrants stay in the UK?
(e) Finally, the frequency of temporary emigrants among residents (at the critical moment of the 2021 Census) was calculated – dividing the reduced (in point d) number of temporary emigrants by the number of residents reported by individual countries.
Figure 3
Algorithm to estimate number of temporary immigrants among residents with Polish citizenship reported by selected European countries at the critical moment of the 2021 Census in Poland (31 March 2021)
Algorithm to estimate number of temporary immigrants among residents with Polish citizenship reported by selected European countries at the critical moment of the 2021 Census in Poland (31 March 2021)
Source: Drawn by the author based on a model developed by the author.
3.5.2.4 Results
167.
(a) Balance method using only Polish data sources;
(b) Mirror statistics approach using foreign data on the number of residents with Polish citizenship.
168.
168. In addition, Table 9 contains number of residents with polish citizenship in 2023 reported by country and frequencies of temporary status among residents obtained using the algorithm presented above. In the case of the UK, due to the lack of relevant data, the number of residents with Polish citizenship since 2022 has been estimated. For this purpose, the results of current research by the UK’s Office for National Statistics on the migration of total residents originating from EU countries and UK visa data on returns and entries were used. The scale of emigration of Polish citizens was estimated based on the total number of emigrants from EU countries using the indicator (proportion) of the share of visas issued to Polish citizens among the total number of return visas for citizens of EU countries. The scale of immigration of Polish citizens was estimated analogously, but on the basis of entry visas to the UK. The number of residents with Polish citizenship in the UK was calculated by adding the balance of migration (based on the estimated volumes of immigration and emigration – described above) to their stock in 2021.
169.
169. For all countries (except France10), the mirror statistics approach shows higher number of Polish immigrants (with temporary status of stay) than analogous results obtained solely from Polish data (Table 10). The highest number of Polish immigrants (with temporary status of stay) resided in United Kingdom (440 thousand), Germany (436 thousand), Netherlands (128 thousand), Norway (80 thousand) and Ireland (68 thousand) (Figure 4).
Table 9
Estimations of temporary immigrants with Polish citizenship in selected European countries (population in thousand) on 31 December 2023.
Estimations of temporary immigrants with Polish citizenship in selected European countries (population in thousand) on 31 December 2023.
|
Country
|
Based on balance method using Polish data
|
Based on mirror statistics using foreign data
|
||
|
Temporary
emigrantsa [A]
|
Temporary status immigrantsb
[B=C*F]
|
Residentsc
[C]
|
Proportion of temporary status among residentsd
[F]
|
|
|
United Kingdom
|
412
|
440
|
723
|
61%
|
|
Germany
|
337
|
436
|
742
|
59%
|
|
Netherlands
|
94
|
128
|
194
|
66%
|
|
Ireland
|
63
|
68
|
104
|
65%
|
|
Norway
|
52
|
80
|
111
|
72%
|
|
Belgium
|
41
|
48
|
68
|
70%
|
|
France
|
36
|
23
|
53
|
43%
|
|
Italy
|
36
|
47
|
73
|
64%
|
|
Sweden
|
30
|
31
|
57
|
54%
|
|
Austria
|
22
|
34
|
68
|
50%
|
|
Spain
|
20
|
29
|
59
|
49%
|
|
Switzerland
|
19
|
27
|
47
|
59%
|
|
Denmark
|
17
|
29
|
48
|
61%
|
a Based on the 2021 Census data corrected by administrative data on migrations.
b Based on Statistics Poland’s estimates calculated by number of residents and frequencies.
d Statistics Poland’s estimates based on domestic and foreign data sources.
Source: Author’s estimates; Eurostat data.
Figure 4
Polish immigrants with temporary type of stay (for at least 12 months) on 31 December 2023 (population in thousands)
Polish immigrants with temporary type of stay (for at least 12 months) on 31 December 2023 (population in thousands)
Source: Map based on data estimated by the author.
Figure 5
Estimations of temporary immigrants with Polish citizenship on 31 December 2023
Estimations of temporary immigrants with Polish citizenship on 31 December 2023
Source: Estimates by the author.
Table 10
Number of immigrants with Polish citizenship with temporary status in selected European countries on 31 December 2023 (population in thousands).
Number of immigrants with Polish citizenship with temporary status in selected European countries on 31 December 2023 (population in thousands).
|
Country
|
Temporary emigrants
Polish data
[A]
|
Temporary immigrants
Mirror statistics
[B]
|
Difference
[D=B-A]
|
Relative difference
[D/A* 100%]
|
|
United Kingdom
|
412
|
440
|
28
|
+7%
|
|
Germany
|
337
|
436
|
99
|
+29%
|
|
Netherlands
|
94
|
128
|
34
|
+36%
|
|
Ireland
|
63
|
68
|
5
|
+8%
|
|
Norway
|
52
|
80
|
28
|
+54%
|
|
Belgium
|
41
|
48
|
7
|
+17%
|
|
France
|
36
|
23
|
–13
|
-37%
|
|
Italy
|
36
|
47
|
11
|
+31%
|
|
Sweden
|
30
|
31
|
1
|
+3%
|
|
Austria
|
22
|
34
|
12
|
+53%
|
|
Spain
|
20
|
29
|
9
|
+41%
|
|
Switzerland
|
19
|
27
|
8
|
+45%
|
|
Denmark
|
17
|
29
|
12
|
+68%
|
|
Total
|
1179
|
1420
|
241
|
+20%
|
Source: Estimates by the author.
170.
170. The largest absolute increase in the number of immigrants – by utilizing mirror statistics – was observed in the following countries (Figure 5 and Table 10): Germany (+99 thousand), Netherlands (+34 thousand), United Kingdom and Norway (+28 thousand). In case of countries analyzed in the table 10 (put together) estimation based on Polish data showed 1.18 million temporary emigrants. With the inclusion of mirror statistics this number amounted to 1.42 million. It means that for every 100 departures for temporary residence for at least 12 months, as many as 83 persons are captured solely by Poland’s data. Table 10 contains also relative differences, which were expressed in relation to results obtained using balance method based only on Poland’s data. The largest percentage increase in the number of immigrants identified by use of mirror statistics was observed for: Denmark (+68%), Norway (+54%) and Austria (+53%).
171.
171. Official statistics on migration are based on data from national registers. The scale of underestimation in national registers’ data is presented in Table 10. It should be noted that the results of the estimate prepared by Statistics Poland reflect the trend and directions of Poles' departures and should not be treated as precise data, but rather as approximate estimates.
3.5.2.5 Conclusions
172.
172. Applying mirror statistics to stock data is laborious and requires the use of many data sources, both in terms of time series (historical) and spatially (from many foreign countries). The reason for using multiple datasets is the requirement to harmonise the definition of population, which varies between countries.
173.
173. Applying mirror statistics reveals a significant underestimation of national Polish data on emigration. For most analyzed countries, this underestimation exceeds 30%, reaching over 50% for some countries of destination. However, for the countries analyzed in total (Table 10) based on mirror statistics, 83 percent of Polish temporary emigrants were captured by Poland’s data.
174.
174. When conducting international migration analyses in Poland, a working assumption is that rates of missed notification of emigrants do not depend on the country of relocation (e.g., it is just as common for people not to notify departure if they are going to Belgium or Germany). This simplified approach was verified by quality assessment of Poland’s 2021 Census. This is also illustrated in Figure 5, which shows the share of Polish residents living in selected European countries. The share based solely on Polish data is similar to the corresponding share derived from foreign data, even though the Polish data underestimates the overall volume of emigration.
175.
175. Precise estimations of demographics and socio-economic statuses of emigrants requires utilization of multiple data sources. Foreign data provide a better indication of the size of immigrations, while Poland’s data (on officially reported emigrations) provides good estimation of the share of emigrations from particular administrative units in Poland (e.g. distribution of emigrations of persons with Polish citizenship to Germany by province), as well as other socio-demographic characteristics of emigrants that are not well measured in receiving countries. Poland’s data on emigration (officially registered departures) is an essential component of Statistics Poland’s annual population balancing.
3.5.2.6 Challenges
176.
176. Developing an algorithm for classification of residents into people with permanent and temporary type of stay:
177.
177. Applying methods for classifying countries according to living conditions with objective to estimate the length of stay immigrants,
178.
178. Including data on the length of stays immigrants in selected European countries.
179.
179. Move toward greater use of these estimations in official statistics. The purpose of these works is to estimate more realistic data on emigrants to help population number and structure adjustments. Adjusted data can be used to improve calculations on variety of indicators regarding social-economic conditions in Poland.
3.5.3 Case study: Italy
180.
180. International migration plays a crucial role in shaping population changes and dynamics, raising awareness among policymakers, researchers and international organizations about the urgent need for accurate and reliable statistics. However, what constitutes reliability for one country may no longer be consistent when cross-checked against migration statistics from other countries. This challenge becomes even more evident within the European Union, where the free movement of people often involves cross-border movements that may be underestimated in official statistics.
181.
181. In Italy, data on migration statistics are compiled from administrative data on changes in residence recorded in the centralized population register (ANPR – Anagrafe Nazionale della Popolazione Residente, managed by the Ministry of the Interior) which Istat accesses on a regular basis (Figure 6).
182.
182. In a first step, data are subject to standard control and correction procedures. The core variables collected are date and place of birth, sex, nationality, level of education, country of origin and destination. In general, the quality of the data is quite high.
183.
183. In a second step, the information is integrated into a demographic data system (Midea-Anvis, MIcro-DEmographic Account – Virtual Statistical register of the population) which, in addition to migrations, incorporates all data on population change (births, deaths, acquisitions of citizenship). Midea-Anvis is a system based on demographic counting of individual data. All data (registered at individual level) are integrated with each other and with respect to the population of the last census, to verify the stock-flow coherence of the information acquired.
184.
184. The last step is to compare Midea-Anvis with a large set of administrative archives (AIDA, Integrated Archive of Administrative Data), thus giving rise to the new edition of the permanent census. Each administrative archive in AIDA provides life signals on habitually resident people who have spent a large part of their time in Italy over the last three years. The comparison between AIDA and Midea-Anvis produces three distinct datasets:
(a) People present in Midea-Anvis and confirmed as residents through the life signals system in AIDA;
(b) People not present in Midea-Anvis but with strong life signals in AIDA (under-coverage);
(c) People present in Midea-Anvis but without life signals in AIDA (over-coverage).
185.
185. The set of people identified at points I and II gives rise to the census population and the longitudinal coherence between two successive censuses and flows is thus ensured. In this way it is possible to provide consistent population and migration statistics, as well as demographic outputs fully consistent with the concepts and definitions set up by the EU Regulations (862/2007 and 1260/2013).The persons included in point III (over-coverage) will be subject to future checks aimed at identifying, within this aggregate, individuals present in the population register who may have emigrated because they show no signs of life. In any case, the quality of the census data is guaranteed because both over-coverage and under-coverage are included in the calculation through a statistical adjustment of the population.
Figure 6
General overview of the data production system
General overview of the data production system
Source: Drawn by the author.
186.
186. The quality of Italian migration data has a positive international impact, as Italy participates in a project aimed at exchanging data and methodological information on migration statistics among national statistical institutes. Given that immigration statistics are generally more accurate than emigration statistics, Italy shares its immigration data with countries that are significant origins of foreign migration flows, such as Romania (since 2013), Albania (since 2017), and Poland (2025) (Figure 7). Occasionally, other countries like Slovenia, Serbia, and Spain have also been involved.
187.
187. Informal agreements reached during working groups or participation in task forces have played a key role in fostering collaboration. These gatherings allowed statisticians from different countries to build relationships, facilitating the exchange of data and strengthening international cooperation in migration statistics.
188.
188. Italy provides Romania and Albania with data on migration flows in aggregate form. The requested breakdowns are usually by sex, age, citizenship and country of birth. When these variables are properly combined, it is possible to obtain accurate estimates of size and structure of the flows. Therefore, it is possible to evaluate the number of people who migrate to Italy, or to build a profile by sex and age. Italy also provides the Polish statistical office with data on population structure and duration of stay for estimating stock of migrants from Poland to Italy.
Figure 7
Immigration flows to Italy by country of origin (Years: 2014–2024)
Immigration flows to Italy by country of origin (Years: 2014–2024)
Source: Drawn by the author based on data from the Italian National Institute of Statistics.
189.
189. To meet the needs of other countries, Italy uploads data on international migration statistics to a platform, ‘Exchange of data and best practices for international migration statistics’, through a limited-access CIRCABC group among EU member states. The data on this platform are used only for validation and development, not for publication.
190.
190. From the point of view of Italy, the currently proposed disaggregation by EU platform (total immigration and emigration flows by country of previous/next residence) is not sufficient, as it only allows for estimating the level of outflows and does not provide important information on the demographic structure of the flows which is essential for determining a quality estimate of mirror statistics. Other disaggregation, such as sex or age, are needed.
191.
191. However, further initiatives in this direction to improve the quality and consistency of the migration statistics and to facilitate the exchange of data between countries are welcome. In addition, these initiatives could also stimulate appropriate discussions aiming at developing a legal framework for monitoring migration flows among countries of the EU and between other countries. This important issue is crucial to the availability of consistent mirror statistics: without a common legal framework at international level, it will be difficult to fully align mirror statistics, despite efforts.