

Chapter 2 Common principles of well-being measurement frameworks
 2.1 Creating, understanding and applying a more holistic picture of societal progress is on the agenda of many national statistical offices, governments and international organisations; several of whom have launched frameworks for measuring well-being over the past decade. This chapter highlights the increasing international consensus on measuring well-being as an outcome-focused assessment of whether life is getting better for people and whether progress has been inclusive and sustainable.
2.2 Section 2.1 summarises the recommendations of several influential international reports and initiatives that have called for and provided the conceptual basis for metrics of societal progress beyond GDP. These have contributed to a proliferation of well-being initiatives, many focusing on monitoring and reporting well-being outcomes, but also increasingly on informing policy practice. Section 2.2 outlines three principles these initiatives have in common, which have informed the recommendations of these Guidelines – namely, 1) a focus on well-being today and its distribution and sustainability; 2) the understanding that well-being is multidimensional and covers all aspects that matter to people’s lives; and 3) inclusion of both objective and subjective outcomes.
2.1 Creating, understanding and applying a more holistic picture of societal progress is on the agenda of many national statistical offices, governments and international organisations; several of whom have launched frameworks for measuring well-being over the past decade. This chapter highlights the increasing international consensus on measuring well-being as an outcome-focused assessment of whether life is getting better for people and whether progress has been inclusive and sustainable.
2.2 Section 2.1 summarises the recommendations of several influential international reports and initiatives that have called for and provided the conceptual basis for metrics of societal progress beyond GDP. These have contributed to a proliferation of well-being initiatives, many focusing on monitoring and reporting well-being outcomes, but also increasingly on informing policy practice. Section 2.2 outlines three principles these initiatives have in common, which have informed the recommendations of these Guidelines – namely, 1) a focus on well-being today and its distribution and sustainability; 2) the understanding that well-being is multidimensional and covers all aspects that matter to people’s lives; and 3) inclusion of both objective and subjective outcomes.
 2.1 Advancements in measuring societal progress
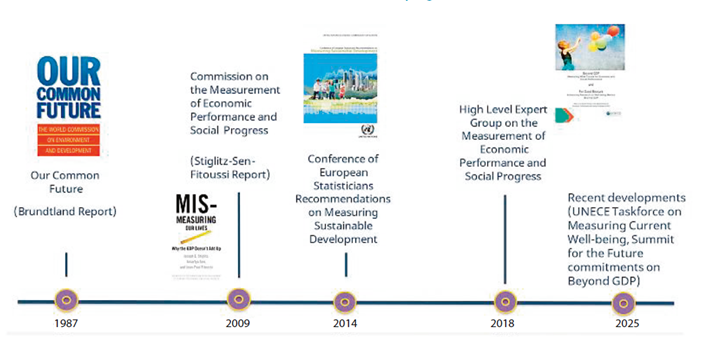
2.3 Many international initiatives have given impetus to the measurement of societal progress (Figure 2.1). This section summarises the main recommendations of particularly influential reports on measuring inclusive and sustainable development and well-being.1
2.1 Advancements in measuring societal progress
2.3 Many international initiatives have given impetus to the measurement of societal progress (Figure 2.1). This section summarises the main recommendations of particularly influential reports on measuring inclusive and sustainable development and well-being.1
Figure 2.1
International initiatives that advanced the measurement of societal progress
International initiatives that advanced the measurement of societal progress
 Our Common Future, United Nations, 1987
2.4 Our Common Future, also known as the Brundtland Report in recognition of Gro Harlem Brundtland, former Norwegian Prime Minister and Chair of the World Commission on Environment and Development, was released in 1987 by the United Nations. It highlighted the interconnectedness between development (particularly of emerging economies) and environmental sustainability. It coined the concept of sustainable development as one that "meets the needs of the present without compromising the ability of future generations to meet their own needs" (Brundtland, 1987). It was hence one of the first times in which a United Nations report explicitly stressed the intertemporal component of social equity (i.e. as existing both within and between generations). The Brundtland Report shaped the international agenda for sustainable development for years to come (Jansen et al, 2023).
Commission on the Measurement of Economic Performance and Social Progress, 2009
2.5 The 2008 global financial crisis accelerated a growing recognition that a sole focus on economic growth, rather than on the people who make up that system, might be setting the wrong incentives for countries’ policy priorities. Nicholas Sarkozy, then President of France, called upon Joseph Stiglitz, Amartya Sen and Jean-Paul Fitoussi to identify the limits of GDP as an indicator of economic performance and social progress, to consider what additional information might be required for the production of more relevant indicators of social progress, to assess the feasibility of alternative measurement tools and to discuss how to present the statistical information in an appropriate way.
2.6 The landmark 2009 report of this Commission, also referred to as the Stiglitz-Sen-Fitoussi Report had an important impact on practices within national statistical offices and beyond and inspired many of the international and national well-being initiatives presented in Section 2.2. It stressed the shortcomings of GDP to account for income inequality, environmental sustainability, and the distribution of economic benefits. Instead, it called for the “development of a statistical system that complements measures of market activity by measures centred on people’s well-being and by measures that capture sustainability. Such a system must, of necessity, be plural – because no single measure can summarize something as complex as the well-being of the members of society, our system of measurement must encompass a range of different measures” (Stiglitz, Sen and Fitoussi, 2009). Hence, the report’s key recommendations were to:
Our Common Future, United Nations, 1987
2.4 Our Common Future, also known as the Brundtland Report in recognition of Gro Harlem Brundtland, former Norwegian Prime Minister and Chair of the World Commission on Environment and Development, was released in 1987 by the United Nations. It highlighted the interconnectedness between development (particularly of emerging economies) and environmental sustainability. It coined the concept of sustainable development as one that "meets the needs of the present without compromising the ability of future generations to meet their own needs" (Brundtland, 1987). It was hence one of the first times in which a United Nations report explicitly stressed the intertemporal component of social equity (i.e. as existing both within and between generations). The Brundtland Report shaped the international agenda for sustainable development for years to come (Jansen et al, 2023).
Commission on the Measurement of Economic Performance and Social Progress, 2009
2.5 The 2008 global financial crisis accelerated a growing recognition that a sole focus on economic growth, rather than on the people who make up that system, might be setting the wrong incentives for countries’ policy priorities. Nicholas Sarkozy, then President of France, called upon Joseph Stiglitz, Amartya Sen and Jean-Paul Fitoussi to identify the limits of GDP as an indicator of economic performance and social progress, to consider what additional information might be required for the production of more relevant indicators of social progress, to assess the feasibility of alternative measurement tools and to discuss how to present the statistical information in an appropriate way.
2.6 The landmark 2009 report of this Commission, also referred to as the Stiglitz-Sen-Fitoussi Report had an important impact on practices within national statistical offices and beyond and inspired many of the international and national well-being initiatives presented in Section 2.2. It stressed the shortcomings of GDP to account for income inequality, environmental sustainability, and the distribution of economic benefits. Instead, it called for the “development of a statistical system that complements measures of market activity by measures centred on people’s well-being and by measures that capture sustainability. Such a system must, of necessity, be plural – because no single measure can summarize something as complex as the well-being of the members of society, our system of measurement must encompass a range of different measures” (Stiglitz, Sen and Fitoussi, 2009). Hence, the report’s key recommendations were to:
•
Define well-being as multidimensional, since a range of dimensions, many of them missed by conventional income measures, shape people’s lives (e.g. material living standards, health, education, work-life balance, civic engagement, social connectedness, the environment). The report further recommends presenting these via a dashboard of indicators, rather than a single index.
•
Distinguish between an assessment of current well-being and its sustainability. Current well-being is people-centric and has to do with both economic resources and non-economic aspects of their life. Whether these levels of well-being can be sustained over time depends on whether stocks of capital that matter for people’s lives (natural, physical, human, social) are passed on to future generations. This recommendation advances the Brundtland Report’s definition of sustainability (in that it encompasses an intertemporal dimension) by emphasising that both domains of well-being should be examined and reported separately, to clarify that there can be trade-offs. A useful analogy motivating the choice for separate assessments is that “when driving a car, a meter that added up in one single number the current speed of the vehicle and the remaining level of gasoline would not be of any help to the driver. Both pieces of information are critical and need to be displayed in distinct, clearly visible areas of the dashboard” (Stiglitz, Sen and Fitoussi, 2009).
•
Comprehensively assess and report inequalities in people’s well-being (e.g. across people, socio-economic groups, gender and generations) across all relevant dimensions.
•
Include both objective life circumstances and subjective measures of well-being (i.e. people’s experiences and perceptions across different dimensions of their lives), to derive a more comprehensive appreciation of people’s well-being. The report also highlights the need to further develop and improve statistical capacity in areas where available indicators remained deficient at the time (e.g. social connectedness, political voice, subjective well-being, indicators drawing on time use surveys).
Recommendations on Measuring Sustainable Development, Conference of European Statisticians, 2014
2.7 In 2009, the Conference of European Statisticians set up a joint UNECE/Eurostat/OECD task force to develop recommendations to harmonise the different ways in which many countries had adopted sustainable development indicator sets. The resulting 2013 recommendations emphasized that human well-being is “a broad concept which is not confined to the utility derived from the consumption of goods and services but is also related to people’s functioning and capabilities (i.e. the freedom and possibilities they have to satisfy their needs)” (UNECE, 2013), and stressed that sustainable development is a matter of distributional justice across time and space. They suggested, like the Stiglitz-Sen-Fitoussi Report, a conceptual distinction between the well-being of the present generation in one country (referred to as ‘here and now’) and the well-being of future generations (‘later’). In addition, a third domain capturing the well-being of people living in other countries (‘elsewhere’) was introduced. This was done to reflect the possible transboundary impacts of development in an increasingly globalized world, by highlighting how a country in the pursuit of the well-being of its citizens may affect the well-being of citizens of other countries (UNECE, 2013).
High Level Expert Group on the Measurement of Economic Performance and Social Progress, 2018
2.8 In 2018, nearly a decade since the publication of the 2009 Commission on the Measurement of Economic Performance and Social Progress report, an OECD-hosted High Level Expert Group on the Measurement of Economic Performance and Social Progress set out future steps for the field of multidimensional well-being measurement. Their recommendations further strengthened several elements of the earlier advice provided in the Stiglitz-Sen-Fitoussi Report, for instance, around prioritising a dashboard of well-being indicators spanning people’s material conditions and the quality of their lives, systematic consideration of inequalities thereof (including equality of opportunity) and sustainability. The High Level Expert Group called for sufficient resources to be provided to national statistical offices, for the development of better quality metrics in areas such as trust, social norms and economic inequality related to income and wealth (including within the System of National Accounts), and for well-being metrics to be used to inform decisions at all stages of the policy process (Stiglitz, Fitoussi and Durand, 2018).
Recent developments
2.9 In more recent years, the United Nations have stimulated a renewed focus on well-being metrics with several new initiatives: these include the in-depth review on measuring current well-being carried out by the Bureau of the Conference of European Statisticians in 2023 and 2022 Valuing What Counts –– United Nations System-wide Contribution on Progress Beyond Gross Domestic Product-report, which highlighted the importance of countries focusing on and tracking the themes of well-being and agency, respect for life and the planet, and reduced inequalities and greater solidarity (United Nations, 2022)
2.10 Particularly from the academic side, conceptual notions of well-being and sustainability have in recent years been further extended to include socio- and planetary boundaries. Drawing on the concepts of so-called sufficientarianism (i.e. every individual should achieve a basic minimum threshold of well-being) and limitarianism (i.e. ecological and social constraints or upper limits of resource use and consumption), a resulting ’sufficiency target space’ would lie between these dual thresholds (Raworth, 2017; Rockström et al., 2023; Gough, 2023). Raworth (2017) presents these planetary and social boundaries in the visualisation of a doughnut. The inside of the doughnut represents the social floors to fulfil basic human needs, while the outer limit denotes the environmental ceiling. Between the boundaries of the doughnut lies an environmentally safe and socially just space in which humanity can thrive. Although the practical reflection of these concepts in well-being metrics is still in the early stages of development, this is an area of increasing government interest (see recent efforts made by Statistics Netherlands and the French Environment and Energy Management Agency (ADEME, 2024)).
2.2 Common principles in measuring well-being
International well-being measurement initiatives
2.11 Following the influential recommendations outlined in Section 2.1, particularly the Stiglitz-Sen-Fitoussi Report, several international measures of societal progress were developed. These include the United Nation’s Human Development Index, the development of which began already in the 1990s, and the subsequent Sustainable Development Goals (SDGs) targets and indicators (Box 2.1), the OECD Framework for Measuring Well-being and associated dashboard as part of its broader Better Life Initiative (Box 2.3) - now housed in the OECD Centre on Well-being, Inclusion, Sustainability, and Equal Opportunity2 - as well as Eurostat’s Quality of Life Initiative (Eurostat, 2015; OECD, 2023; United Nations Department of Economic and Social Affairs Statistics Division, 2017; United Nations Development Programme, 2023).3 Looking forward, the Pact for the Future adopted at the 2024 United Nations Summit for the Future includes a commitment to develop a “framework containing a limited number of country-owned and universally applicable measures of progress on sustainable development to complement and go beyond GDP”.4
Box 2.1
The Sustainable Development Goals
The Sustainable Development Goals
The Sustainable Development Goals (SDGs) are at the core of the 2030 Agenda for Sustainable Development, adopted by all UN Member States in 2015 (United Nations, 2015). They are comprised of 17 goals that are underpinned by 169 targets and 231 indicators, focusing on the themes of People, Planet, Prosperity, Peace, and Partnership (Figure 2.2). While not legally binding, countries are expected to establish national frameworks to achieve and monitor the goals.
Figure 2.2
The Sustainable Development Goals
The Sustainable Development Goals
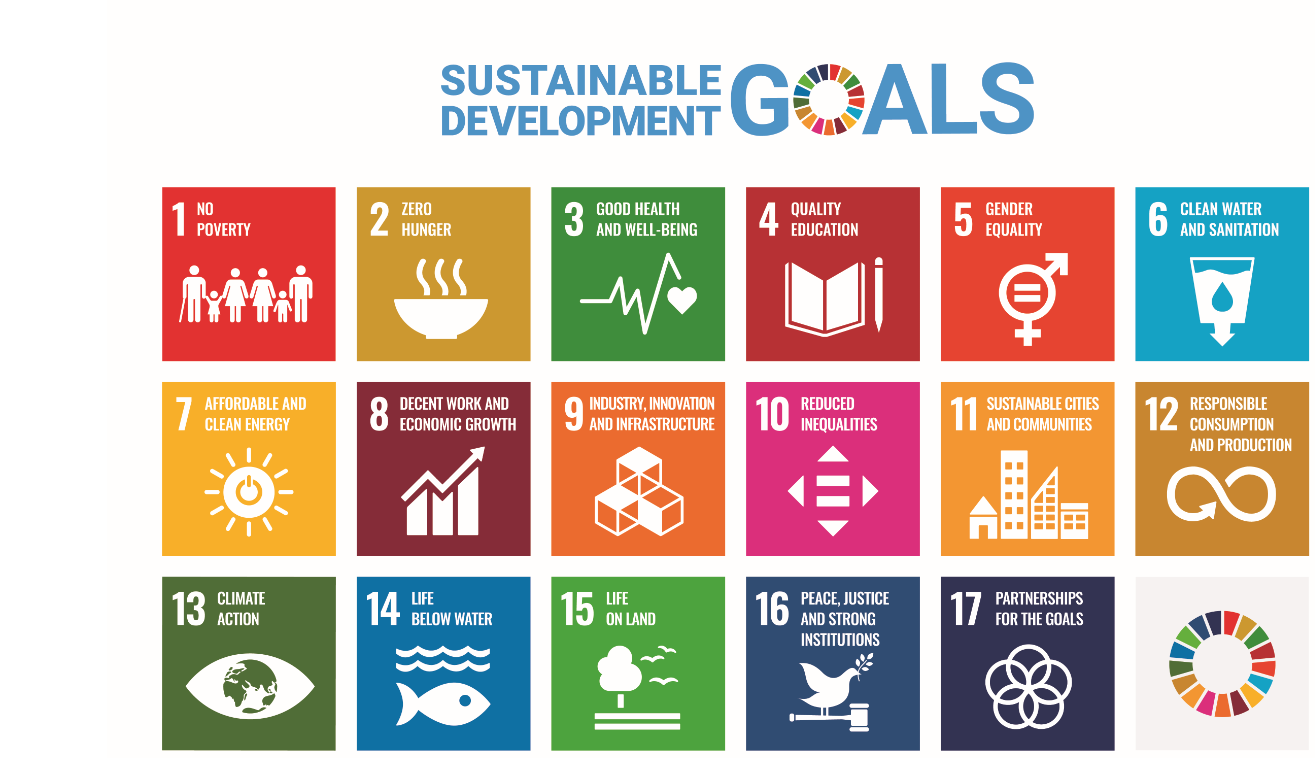 The SDGs provide a multi-dimensional framework with a focus on sustainability and equality. Many SDG themes map well against commonly used well-being dimensions, for instance, in the OECD Well-being Framework or in national well-being frameworks (see Figure 2.7).
There are also important differences: the SDGs are a list of policy commitments agreed to by world leaders and include targets and timeframes for achieving them. In contrast, well-being measurement frameworks are typically analytic and diagnostic tools to assess the well-being of people and communities without agreed-upon targets. Further, the SDGs provide a fixed selection of internationally comparable indicators, whereas national frameworks have the option to add richer nationally available data when relevant.
In practice, countries with national well-being frameworks often must balance their well-being reporting with reporting on related beyond GDP initiatives, including the SDGs. While some might prefer to maintain separate communication outputs to avoid confusion (also driven by the fact that different teams may be responsible for these as separate workstreams), an increasing subset of countries is taking a cohesive approach that combines reporting on multiple frameworks in one product and highlights the synergies between the frameworks. For example, the Netherlands’ Monitor of Well-being and the SDGs cover both the nationally developed well-being framework and the SDGs (Box 2.4). When developing a national well-being framework, countries may draw on experiences from the implementation of the SDGs, including stakeholder engagement, mapping of SDGs to nationally available data and publication of SDG dashboards.
National well-being measurement initiatives
2.12 At the national level, many statistical offices and government departments have started to explicitly group a variety of social, environmental and economic data – some of which they had already been collecting for many years - under the`` banner of measuring well-being or going beyond GDP. As of 2024, more than 40% of UNECE Member countries have developed national frameworks, development plans or surveys with a multidimensional well-being focus, with this activity having accelerated in recent years (Figure 2.3).
The SDGs provide a multi-dimensional framework with a focus on sustainability and equality. Many SDG themes map well against commonly used well-being dimensions, for instance, in the OECD Well-being Framework or in national well-being frameworks (see Figure 2.7).
There are also important differences: the SDGs are a list of policy commitments agreed to by world leaders and include targets and timeframes for achieving them. In contrast, well-being measurement frameworks are typically analytic and diagnostic tools to assess the well-being of people and communities without agreed-upon targets. Further, the SDGs provide a fixed selection of internationally comparable indicators, whereas national frameworks have the option to add richer nationally available data when relevant.
In practice, countries with national well-being frameworks often must balance their well-being reporting with reporting on related beyond GDP initiatives, including the SDGs. While some might prefer to maintain separate communication outputs to avoid confusion (also driven by the fact that different teams may be responsible for these as separate workstreams), an increasing subset of countries is taking a cohesive approach that combines reporting on multiple frameworks in one product and highlights the synergies between the frameworks. For example, the Netherlands’ Monitor of Well-being and the SDGs cover both the nationally developed well-being framework and the SDGs (Box 2.4). When developing a national well-being framework, countries may draw on experiences from the implementation of the SDGs, including stakeholder engagement, mapping of SDGs to nationally available data and publication of SDG dashboards.
National well-being measurement initiatives
2.12 At the national level, many statistical offices and government departments have started to explicitly group a variety of social, environmental and economic data – some of which they had already been collecting for many years - under the`` banner of measuring well-being or going beyond GDP. As of 2024, more than 40% of UNECE Member countries have developed national frameworks, development plans or surveys with a multidimensional well-being focus, with this activity having accelerated in recent years (Figure 2.3).
Figure 2.3
Growth of national well-being frameworks in UNECE countries since 2000
Growth of national well-being frameworks in UNECE countries since 2000

Source: Adapted from OECD, 2023, with additional research done to include non-OECD UNECE Members
2.13 Many of these national initiatives focus on well-being measurement, monitoring and reporting (often, but not exclusively, led by national statistical offices), whereas others have been developed to support more direct policy applications (often led by Ministries of Finance or other policy ministries) (Exton and Shinwell, 2018) (Box 2.2). The majority of national initiatives follow the recommendations of the Stiglitz-Sen-Fitoussi Report in opting for a dashboard approach, rather than aggregating across dimensions to create a single composite indicator, although countries such as Luxembourg, Poland and Portugal have opted for a well-being index (OECD, 2023). The dashboards take different shapes and sizes, depending on their use. Frameworks focused on monitoring and reporting typically involve building an evidence base on the state of a country’s well-being (i.e. a comprehensive indicator set, sometimes including 100+ individual indicators) and making this information publicly available for users and stakeholders. Conversely, well-being frameworks that have been developed for specific policy applications (e.g. for informing budgetary discussions) often have far fewer distinct indicators, sometimes as few as five (OECD, 2019). In some cases, such as Italy and New Zealand, both a larger dashboard for well-being monitoring and a shorter indicator subset for policy application have been developed (Exton and Shinwell, 2018).
Box 2.2
Examples of well-being policy practice
Examples of well-being policy practice
Governments employ different strategic, operational and technical methods to support the use of well-being frameworks and principles for shaping national policy processes. In 2023, the OECD launched a Knowledge Exchange Platform on Well-being Metrics and Policy Practice for peer-learning and innovation sharing for governments, offering an online repository of country well-being initiatives and targeted workshops on well-being policy implementation.
Principles
Well-being frameworks simultaneously emphasize broad, granular, and long-term analysis of policy priorities and options that respond directly to people’s needs across a range of life areas. They typically also support ways of working that transcend policy silos through increased collaboration, coordination, iteration, and transparency. Different countries set out the principles or motivating factors of a well-being approach in different ways (for example Department of Finance Canada, 2021; New Zealand Treasury, 2019; National Assembly of Wales, 2015), but common themes include (1) taking a whole of government approach (2) attending to intergenerational outcomes and inequalities between population groups, and (3) moving towards multidimensional measures of success.
Applications
Well-being policy approaches encompass a broad range of applications, including (1) well-being evidence in budgetary decision-making processes (e.g. in Italy, New Zealand, Canada, Ireland, France, Sweden, Iceland and the Netherlands; (2) a well-being approach to high-level strategic coordination and priority-setting exercises (e.g. performance frameworks in Iceland and Scotland and national development plans in Colombia and Slovenia); (3) well-being policy analysis, appraisal and evaluation methods (e.g. the development of well-being valuation methods to integrate in cost-benefit analysis in the United Kingdom and New Zealand, forecasting techniques to more accurately predict the potential impact of policies on societal outcomes in Italy and inclusion of expected well-being impacts in implementation strategies and public reporting on departmental results in Canada.
Embedding mechanisms
Countries are employing different techniques to embed the use and understanding of well-being policy frameworks and principles across government and electoral cycles. These include legislation (e.g. Wales, New Zealand), civil service capacity-building and support (e.g. the United Kingdom, New Zealand), and cross-departmental coordinating bodies (e.g. New Zealand).
Source: (OECD, 2023)
Common principles across well-being measurement frameworks
2.14 While many national well-being approaches draw from well-established international models, including the OECD Well-being Framework, the UN Sustainable Development Goals and Eurostat’s Quality of Life framework, they can usually draw on richer data and almost always include some adaptation to the national context (further described below, and in Chapter 6 on national implementation of well-being frameworks).
2.15 Regardless, an encouraging takeaway from reviewing well-being measurement practice is that there is much common understanding of its conceptual underpinnings. They share three key principles that mirror the recommendations set out in Section 2.1:
•
They make a distinction between current well-being and future well-being, or sustainability, while considering the distributional aspects of well-being to reflect how inclusive it is.
•
They understand well-being as a multidimensional construct that covers people’s experiences across diverse areas.
•
The dashboards used to operationalize the frameworks' focus, wherever possible, on well-being outcomes (as opposed to drivers) and include both objective and subjective indicators of well-being.
2.16 Following these principles, these Guidelines focus on well-being here and now. Chapter 3 provides practical guidance on how to integrate measures of inequalities when building a national well-being measurement framework. Each of these common principles is presented alongside case studies of relevant well-being initiatives. The chosen examples are not meant to be representative of all existing initiatives but serve to illustrate how the respective principles have been operationalized in practice.
|
Principle 1. Well-being statistics distinguish between current well-being (and its distribution) and resources for future well-being
|
2.17 In line with the recommendations of the Commission on the Measurement of Economic Performance and Social Progress and the Conference of European Statisticians, many well-being initiatives are built around different concepts: on the one hand, current well-being, which refers to outcomes (achievements) at the individual, household and community level that matter to people’s quality and experience of life ‘here and now’. Most initiatives also consider that measurement of well-being should cover all groups in the society and place particular emphasis on inclusion and the need for more granular data to understand the distribution of well-being outcomes across the population (OECD 2023, WISE Horizon 2023). On the other hand, resources for future well-being are reflected by the conditions and resources needed to sustain current well-being over time, often captured at the system-wide level (e.g. characteristics of the economy, ecosystems or institutions, often referred to as different types of natural, human, social and economic capital stocks).
2.18 Initiatives articulate current well-being, its distribution, as well as resources for future well-being in different ways. One way, as done in the OECD Well-being Framework (Box 2.3), Belgium’s Complementary Indicators to GDP, Treasury New Zealand’s Living Standards Framework, Stats NZ’s Indicators Aotearoa New Zealand, and the Netherland’s Well-being Monitor (Box 2.4) is to make an explicit conceptual distinction between dashboards for current well-being and resources for future well-being. The Netherlands’ Well-being Monitor and Stats NZ’s Indicators Aotearoa New Zealand) also recognize transboundary effects – i.e. the impact that countries have on well-being in other countries, as per the 2013 recommendations of the Conference of European Statisticians. Another way is to emphasize sustainability explicitly as a cross-cutting lens, such as in Canada’s Quality of Life Framework (Box 2.5) or, as a large share of frameworks do, by including elements of human, social, economic and natural capital within their well-being indicator sets, without specific reference to resources for future well-being as distinct domain (Exton and Fleischer, 2019). Well-being inequalities are typically captured in a transversal way across frameworks, rather than as a separate dimension (OECD, 2023).
Box 2.3
Case study – The OECD Well-being Framework
Case study – The OECD Well-being Framework
The OECD Well-being Framework is an outcome-focused tool to measure human and societal conditions and progress. The Framework was launched in 2011 and developed under the guidance of the OECD Committee on Statistics and Statistical Policy and reflects the academic literature on welfare measurement and emerging consensus in country practices on GDP and beyond approaches. It is periodically reviewed to ensure alignment with developments since its launch (Exton and Fleischer, 2019).
Figure 2.4
The OECD Well-being Framework
The OECD Well-being Framework
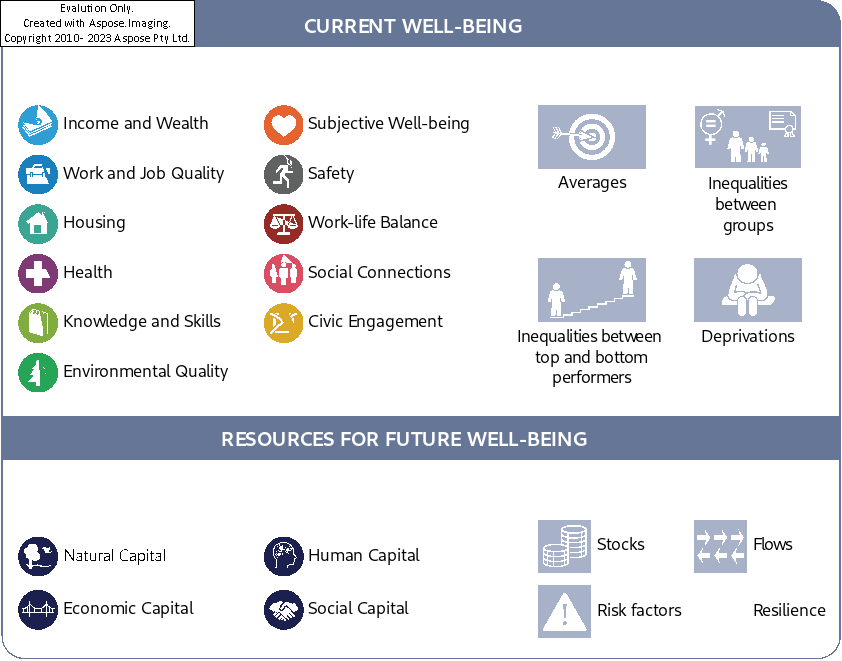 The framework covers current well-being and resources for future well-being. Current well-being is comprised of 11 dimensions: these relate to material conditions that shape people’s economic options; quality-of-life factors that encompass how well people are, what they know and can do, and how healthy and safe their places of living are; and community relations encompassing how connected and engaged people are, and how and with whom they spend their time. Three types of inequalities are considered for all indicators: gaps between population groups (e.g. between men and women, old and young people); gaps between those at the top and those at the bottom of the achievement scale (e.g. the income of the richest 20% of individuals compared to that of the poorest 20%); and deprivations (the share of the population falling below a given threshold of achievement, e.g. a minimum level of skills or health).
Resources for future well-being are expressed in terms of a country’s investment in (or depletion of) different types of resources. They include natural capital (stocks of natural resources, biodiversity and ecosystems), economic capital (produced capital and financial assets), human capital (skills and future health of the population) and social capital (social norms, shared values and institutional arrangements that foster cooperation).
The regular OECD How’s Life? report draws together the available internationally harmonised data across the OECD Well-being Framework (OECD, 2024). While there remain some important measurement gaps, every domain of the framework has some international data. A quarterly updated dataset of over 80 well-being indicators is available at OECD Data Explorer.
The framework covers current well-being and resources for future well-being. Current well-being is comprised of 11 dimensions: these relate to material conditions that shape people’s economic options; quality-of-life factors that encompass how well people are, what they know and can do, and how healthy and safe their places of living are; and community relations encompassing how connected and engaged people are, and how and with whom they spend their time. Three types of inequalities are considered for all indicators: gaps between population groups (e.g. between men and women, old and young people); gaps between those at the top and those at the bottom of the achievement scale (e.g. the income of the richest 20% of individuals compared to that of the poorest 20%); and deprivations (the share of the population falling below a given threshold of achievement, e.g. a minimum level of skills or health).
Resources for future well-being are expressed in terms of a country’s investment in (or depletion of) different types of resources. They include natural capital (stocks of natural resources, biodiversity and ecosystems), economic capital (produced capital and financial assets), human capital (skills and future health of the population) and social capital (social norms, shared values and institutional arrangements that foster cooperation).
The regular OECD How’s Life? report draws together the available internationally harmonised data across the OECD Well-being Framework (OECD, 2024). While there remain some important measurement gaps, every domain of the framework has some international data. A quarterly updated dataset of over 80 well-being indicators is available at OECD Data Explorer.
Box 2.4
Case study – the Dutch Monitor of Well-being and the SDGs
Case study – the Dutch Monitor of Well-being and the SDGs
The Dutch term for sustainable and inclusive well-being – brede welvaart – has become a core concept in policy making, emerging in response to a call by Parliament for metrics supporting a broader evaluation of policy beyond GDP. Statistics Netherlands has been publishing the Monitor of Well-being and the Sustainable Development Goals annually since 2018 at the request of the House of Representatives to provide an overview of the state and development of sustainable and inclusive well-being when the government reports to the House of Representatives on its annual goals and achievements.
The core of the Monitor consists of statistical information on well-being here and now, later, and elsewhere (Figure 2.5). Information on these three domains of well-being is systematically linked to more detailed information on the distribution among population groups, the Sustainable Development Goals, and the resilience of well-being.
Figure 2.5
The three domains of the Dutch Monitor of Well-being
The three domains of the Dutch Monitor of Well-being
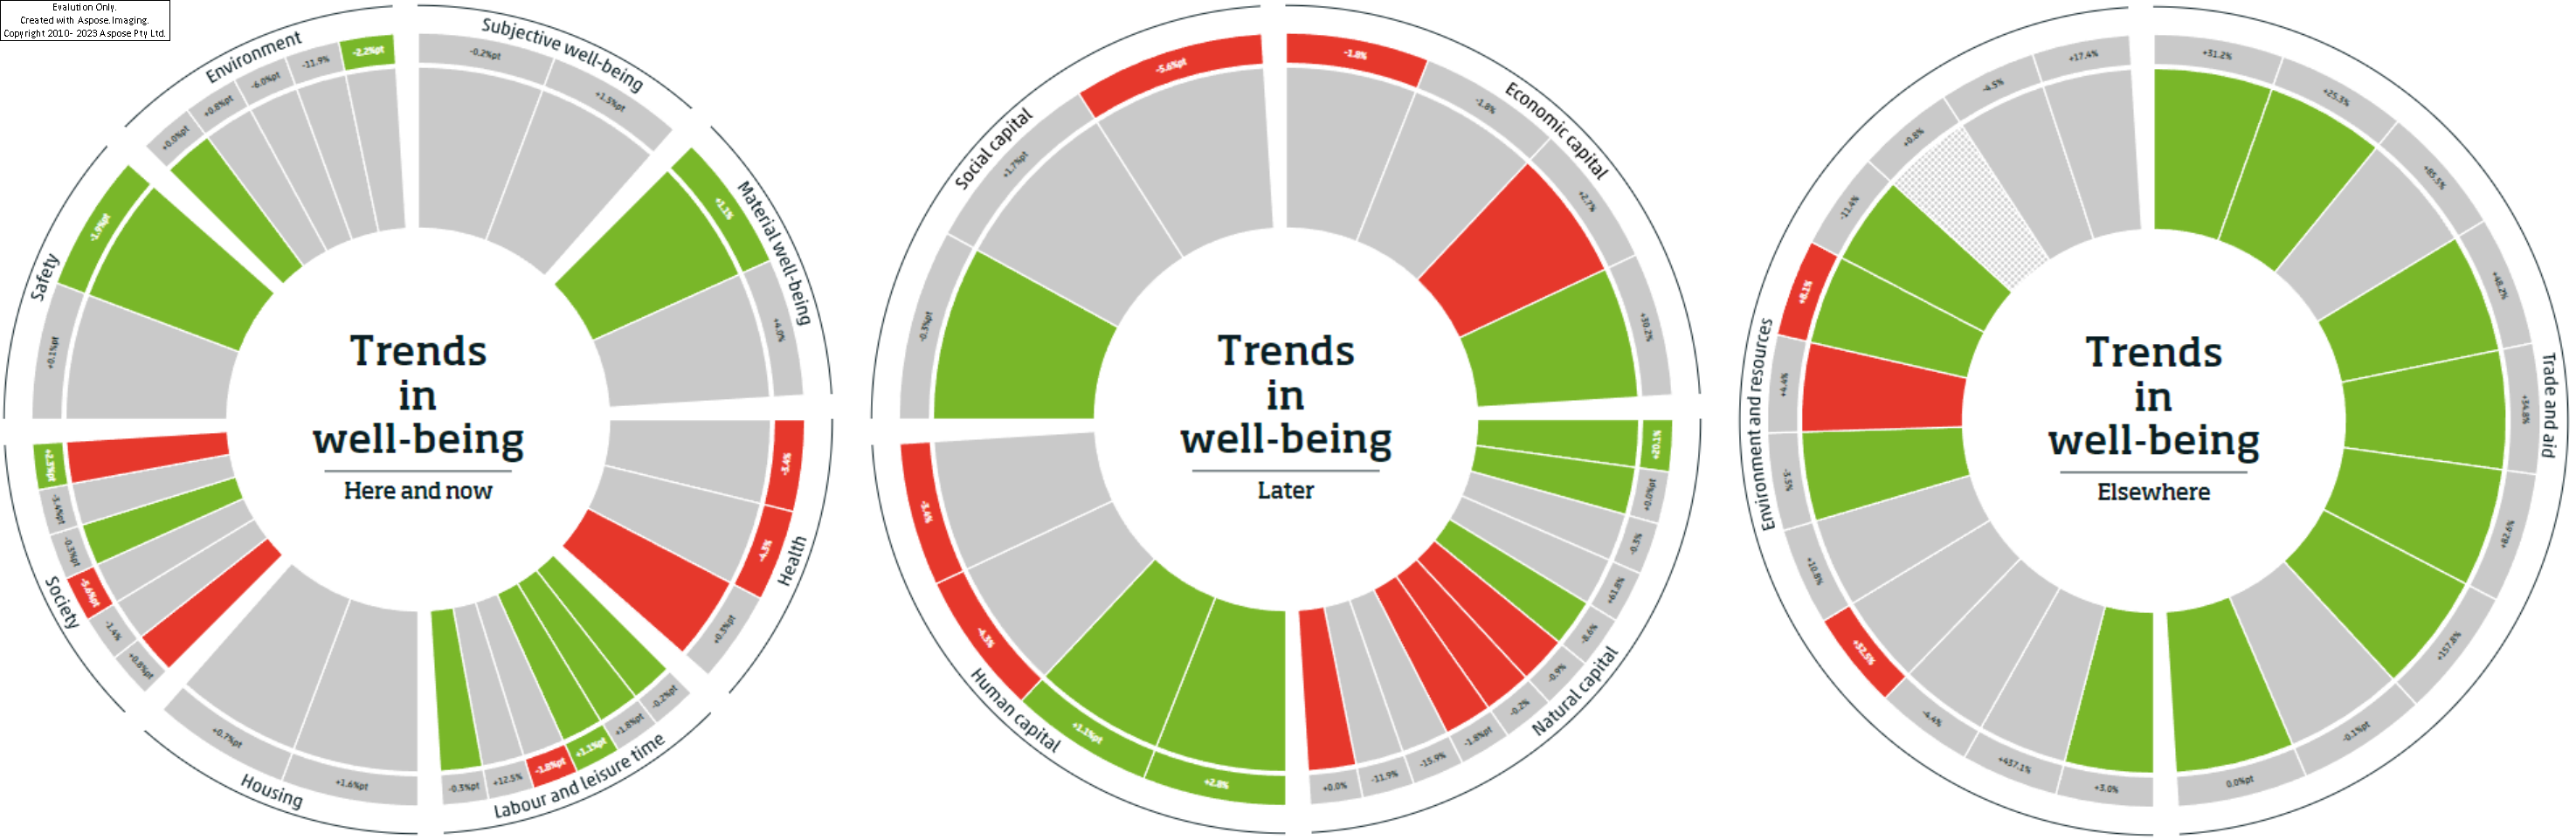 Well-being here and now consists of eight dimensions: subjective well-being, material well-being, health, labour and leisure time, housing, society, safety and environment. When possible, each dimension includes subjective indicators. The Monitor analyses the distribution of current well-being among population groups by gender, age, education and country of birth/origin, as well as outcomes at the individual level for a representative sample of 7000 respondents.
Well-being later refers to the resources future generations will need to achieve current well-being. The Monitor considers these via measures of economic, human, social and natural capital.
Well-being elsewhere assesses the impact of Dutch policies on well-being in other countries (classified by low, lower-middle, upper-middle, and high-income groups) via the two themes of trade and aid, and environment and resources. Examples of indicators include biomass, metal and fossil fuel imports, official development assistance and remittances.
The SDGs are integrated in the Monitor, considering a combination of Sen’s capability approach and the intervention logic of policy making. The Monitor includes a separate dashboard on the resilience of well-being (i.e. its ability to absorb shocks and recover). The resilience dashboard contains six themes linked to the three domains of well-being: livelihood of households, prevalence of vulnerable groups (well-being here and now); robustness of the biosphere, society, and economy, critical systems, government leverage (well-being later) and cross-border dependencies (well-being elsewhere). Since 2020, a regional Monitor that assesses outcomes for provinces, regions and municipalities has also been published.
Source: (CBS, 2024)
Well-being here and now consists of eight dimensions: subjective well-being, material well-being, health, labour and leisure time, housing, society, safety and environment. When possible, each dimension includes subjective indicators. The Monitor analyses the distribution of current well-being among population groups by gender, age, education and country of birth/origin, as well as outcomes at the individual level for a representative sample of 7000 respondents.
Well-being later refers to the resources future generations will need to achieve current well-being. The Monitor considers these via measures of economic, human, social and natural capital.
Well-being elsewhere assesses the impact of Dutch policies on well-being in other countries (classified by low, lower-middle, upper-middle, and high-income groups) via the two themes of trade and aid, and environment and resources. Examples of indicators include biomass, metal and fossil fuel imports, official development assistance and remittances.
The SDGs are integrated in the Monitor, considering a combination of Sen’s capability approach and the intervention logic of policy making. The Monitor includes a separate dashboard on the resilience of well-being (i.e. its ability to absorb shocks and recover). The resilience dashboard contains six themes linked to the three domains of well-being: livelihood of households, prevalence of vulnerable groups (well-being here and now); robustness of the biosphere, society, and economy, critical systems, government leverage (well-being later) and cross-border dependencies (well-being elsewhere). Since 2020, a regional Monitor that assesses outcomes for provinces, regions and municipalities has also been published.
Source: (CBS, 2024)
Box 2.5
Case study – Canada’s Quality of Life Framework
Case study – Canada’s Quality of Life Framework
Canada’s Quality of Life Framework was initially developed as a tool for performance budgeting. It is progressively being used for additional functions throughout the policy cycle, from policy development to implementation strategies, to monitoring and reporting on results.
Figure 2.6
Objectives of Canada’s Framework
Objectives of Canada’s Framework
 Current well-being is the primary focus of the domain structure, while the transversal ‘sustainability and resilience’ lens focuses explicitly on sustainability. Importantly, this long-term emphasis is not limited to environmental sustainability; it extends across all five domains of the framework: prosperity, health, society, good governance, and environment. This transversal treatment is similar to the approach used in Canada’s Quality of Life Framework to address distributional differences in outcomes and inclusion.
Complementary Government of Canada tools and mechanisms directly address sustainability. In particular, a climate, nature and economy lens sets thresholds for economic and climate impacts above which modelling of expected impacts of policy and budget proposals must be centrally vetted by experts. Triennial updates to the Federal Sustainable Development Strategy (a legislated requirement) are based on the principle that the Government should integrate environmental, economic and social factors in the making of all of its decisions; as well as the principle of intergenerational equity, the importance of meeting the needs of the present generation without compromising the ability of future generations to meet their own needs.
Current well-being is the primary focus of the domain structure, while the transversal ‘sustainability and resilience’ lens focuses explicitly on sustainability. Importantly, this long-term emphasis is not limited to environmental sustainability; it extends across all five domains of the framework: prosperity, health, society, good governance, and environment. This transversal treatment is similar to the approach used in Canada’s Quality of Life Framework to address distributional differences in outcomes and inclusion.
Complementary Government of Canada tools and mechanisms directly address sustainability. In particular, a climate, nature and economy lens sets thresholds for economic and climate impacts above which modelling of expected impacts of policy and budget proposals must be centrally vetted by experts. Triennial updates to the Federal Sustainable Development Strategy (a legislated requirement) are based on the principle that the Government should integrate environmental, economic and social factors in the making of all of its decisions; as well as the principle of intergenerational equity, the importance of meeting the needs of the present generation without compromising the ability of future generations to meet their own needs.
|
Principle 2. Well-being is multidimensional
|
2.19 All initiatives consider well-being as multidimensional, and take into account multiple dimensions that matter to people’s lives – including their material conditions (e.g. income, jobs, housing), their quality of life (e.g. health, education and skills, safety, subjective well-being, the environment), their relationships with others and the institutions that serve them (e.g. social connectedness civic engagement), as well as different types of economic, social and environmental sustainability (see Boxes 2.6 and 2.7 for Ireland’s and Italy’s experience of selecting their well-being dimensions). An illustrative mapping of selected national and international well-being initiatives against the dimensions of well-being, inclusion and sustainability in the OECD Well-being Framework shows a high level of agreement (Figure 2.7).
Figure 2.7
Well-being initiatives share common dimensions
Well-being initiatives share common dimensions
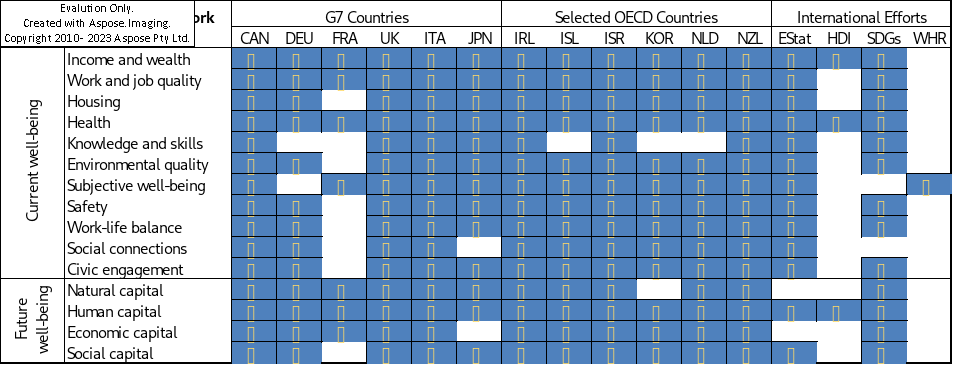
Note: this figure shows overlaps in concepts included in the OECD's Well-being Framework and national programs for all G7 countries and other selected countries. Shaded cells indicate the initiative contains indicators that overlap with indicators in the OECD Well-being Framework dimension. Initiatives included: Canada (CAN); Germany (DEU); France (FRA); United Kingdom (UK); Italy (ITA); Japan (JPN); Ireland (IRL); Iceland (ISL); Israel (ISR); Korea (KOR); the Netherlands (NLD); New Zealand (NZL); Eurostat (EStat); Human Development Index (HDI); SDGs; and World Happiness Report (WHR). Initiatives are structured in different ways, and their domain or dimension names may not follow the exact naming convention or structure as that of the OECD.
Source: OECD, 2023
2.20 It is worth noting that beyond the similarities in well-being dimensions, most well-being measurement initiatives also already include a share of indicators that are internationally harmonized (see Exton and Fleischer, 2019 for a detailed description of indicator-level overlaps). While there is no complete standardisation of the underlying measurement framework used at the national level, akin to the System of National Accounts (SNA) (Hoekstra, 2019), some degree of standardization is already possible – at least in the global North – through common international definitions of, for example, life expectancy, household income and debt, and a wide variety of labour market outcomes. The UN 2030 Agenda and its SDGs have also advanced measurement of a range of outcomes, including in the Global South.
2.21 In areas where there have traditionally been fewer international standards, considerable effort has been made by international organisations over the past decade to develop measurement guidelines, including on the distribution of household income, consumption and wealth; subjective well-being; trust; the quality of the working environment; digital platform employment; and population mental health (OECD, 2023). Regardless, gaps remain in other areas, such as social connectedness (OECD, 2024). Relatedly, the United Nations Statistical Commission (UNSC) created a Friends of the Chair (FoC) Group on social and demographic statistics in 2022 to review the social pillar of statistics and make recommendations to strengthen and improve it (UNSC, 2022).
2.22 The FoC Group initially focused on three main work streams: mapping global and regional work in social and demographic statistics, identifying elements for an overarching conceptual framework to improve interoperability within the social statistics pillar5, as well as integration with the economic and environmental pillars and elevating the role of social and demographic statistics in the eyes of data users and producers. A consensus has emerged from this work around five common ‘building blocks’ – people, relationships, outcomes, places and time – where progressive harmonization of standards and classifications (such as the work of this task force related to ‘outcomes’) could improve interoperability. This more integrated data infrastructure would also serve to progressively strengthen a multi-disciplinary evidence base and eventual overarching conceptual framework, which better addresses relationships between outcomes and other components of the system.
2.23 In parallel, further efforts within the SNA will eventually help fill other important international gaps on some aspects of economic well-being and sustainability (Box 2.8). These combined efforts mean that overall, there are considerable similarities in the data that countries use to measure well-being, which will likely converge further in the future.
2.24 Beyond common core themes and indicators that are already internationally comparable, most national well-being initiatives draw on richer national data sources to consider country-specific and contextual factors. Examples of additional dimensions or topics that were found across national frameworks include themes such as identity and language, diversity and discrimination, culture, and sports, accessibility and quality of services, domestic violence, disaster preparedness and resilience, collective family and community well-being (which can include the well-being of nature seen as intrinsically valuable rather than an asset to be utilized, a view often expressed in Indigenous-focused frameworks), and transboundary impacts (OECD, 2023). For more information on how to consider country-specific indicators, see Chapter 6.
2.25 A significant driver of national variations has been the need for strong stakeholder buy-in and ownership, which means that many national well-being initiatives have been co-designed with inputs from a large variety of stakeholders. Public consultation has been a key component of framework development in almost all OECD countries, as has expert consultation, the involvement of multiple government ministries, and cross-party political engagement (OECD, 2023) (Boxes 2.6 and 2.7). One of the success factors often cited for ensuring an enduring approach is this consultative activity from the outset (Wellbeing Economy Alliance, 2021), so even if many national initiatives share a common core, the terminology and overall structure of the framework needs to reflect the issues that emerge through these bottom-up processes, to ensure it has legitimacy with the communities who will later use or be impacted by it.
Box 2.6
Case study – Ireland’s Well-being Framework
Case study – Ireland’s Well-being Framework
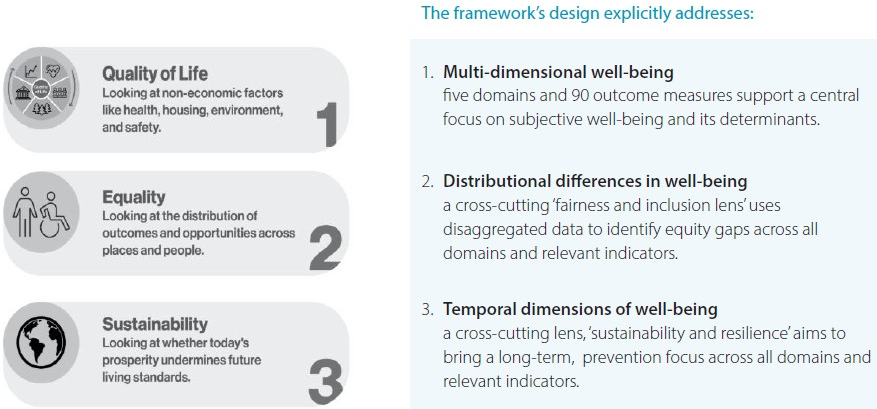
The Irish Well-being Framework was launched by the Government of Ireland in July 2021. It seeks to move beyond using just economic measures in gauging progress as a country, by looking at economic, environmental and social issues together. It focuses on quality of life, with a particular emphasis on equality and sustainability.
A collaborative and wide-ranging approach in the development of the framework was pursued with the lead Departments (Department of the Taoiseach, Departments of Finance and Public Expenditure and Reform), an Inter-departmental Working Group with all Government Departments, the Central Statistics Office (CSO) and the National Economic and Social Council working closely together. Consultations were held with stakeholders, experts and the public.
The Irish Well-being Framework informs a multidimensional assessment of the country’s performance across 11 dimensions and 35 indicators of well-being (Figure 2.8). Sustainability and equality are considered in a cross-cutting manner, by tagging indicators that are particularly important for economic, social and environmental sustainability and by identifying differences between population groups.
Ireland's Framework has been designed to reflect the OECD Well-being Framework to allow for meaningful international comparison, but adjusted to the Irish context and perspective. Together, the dimensions of the Framework capture a holistic picture of the key elements that make up well-being for Ireland, across person, place, and society.
Figure 2.8
The Irish Well-being Framework
The Irish Well-being Framework
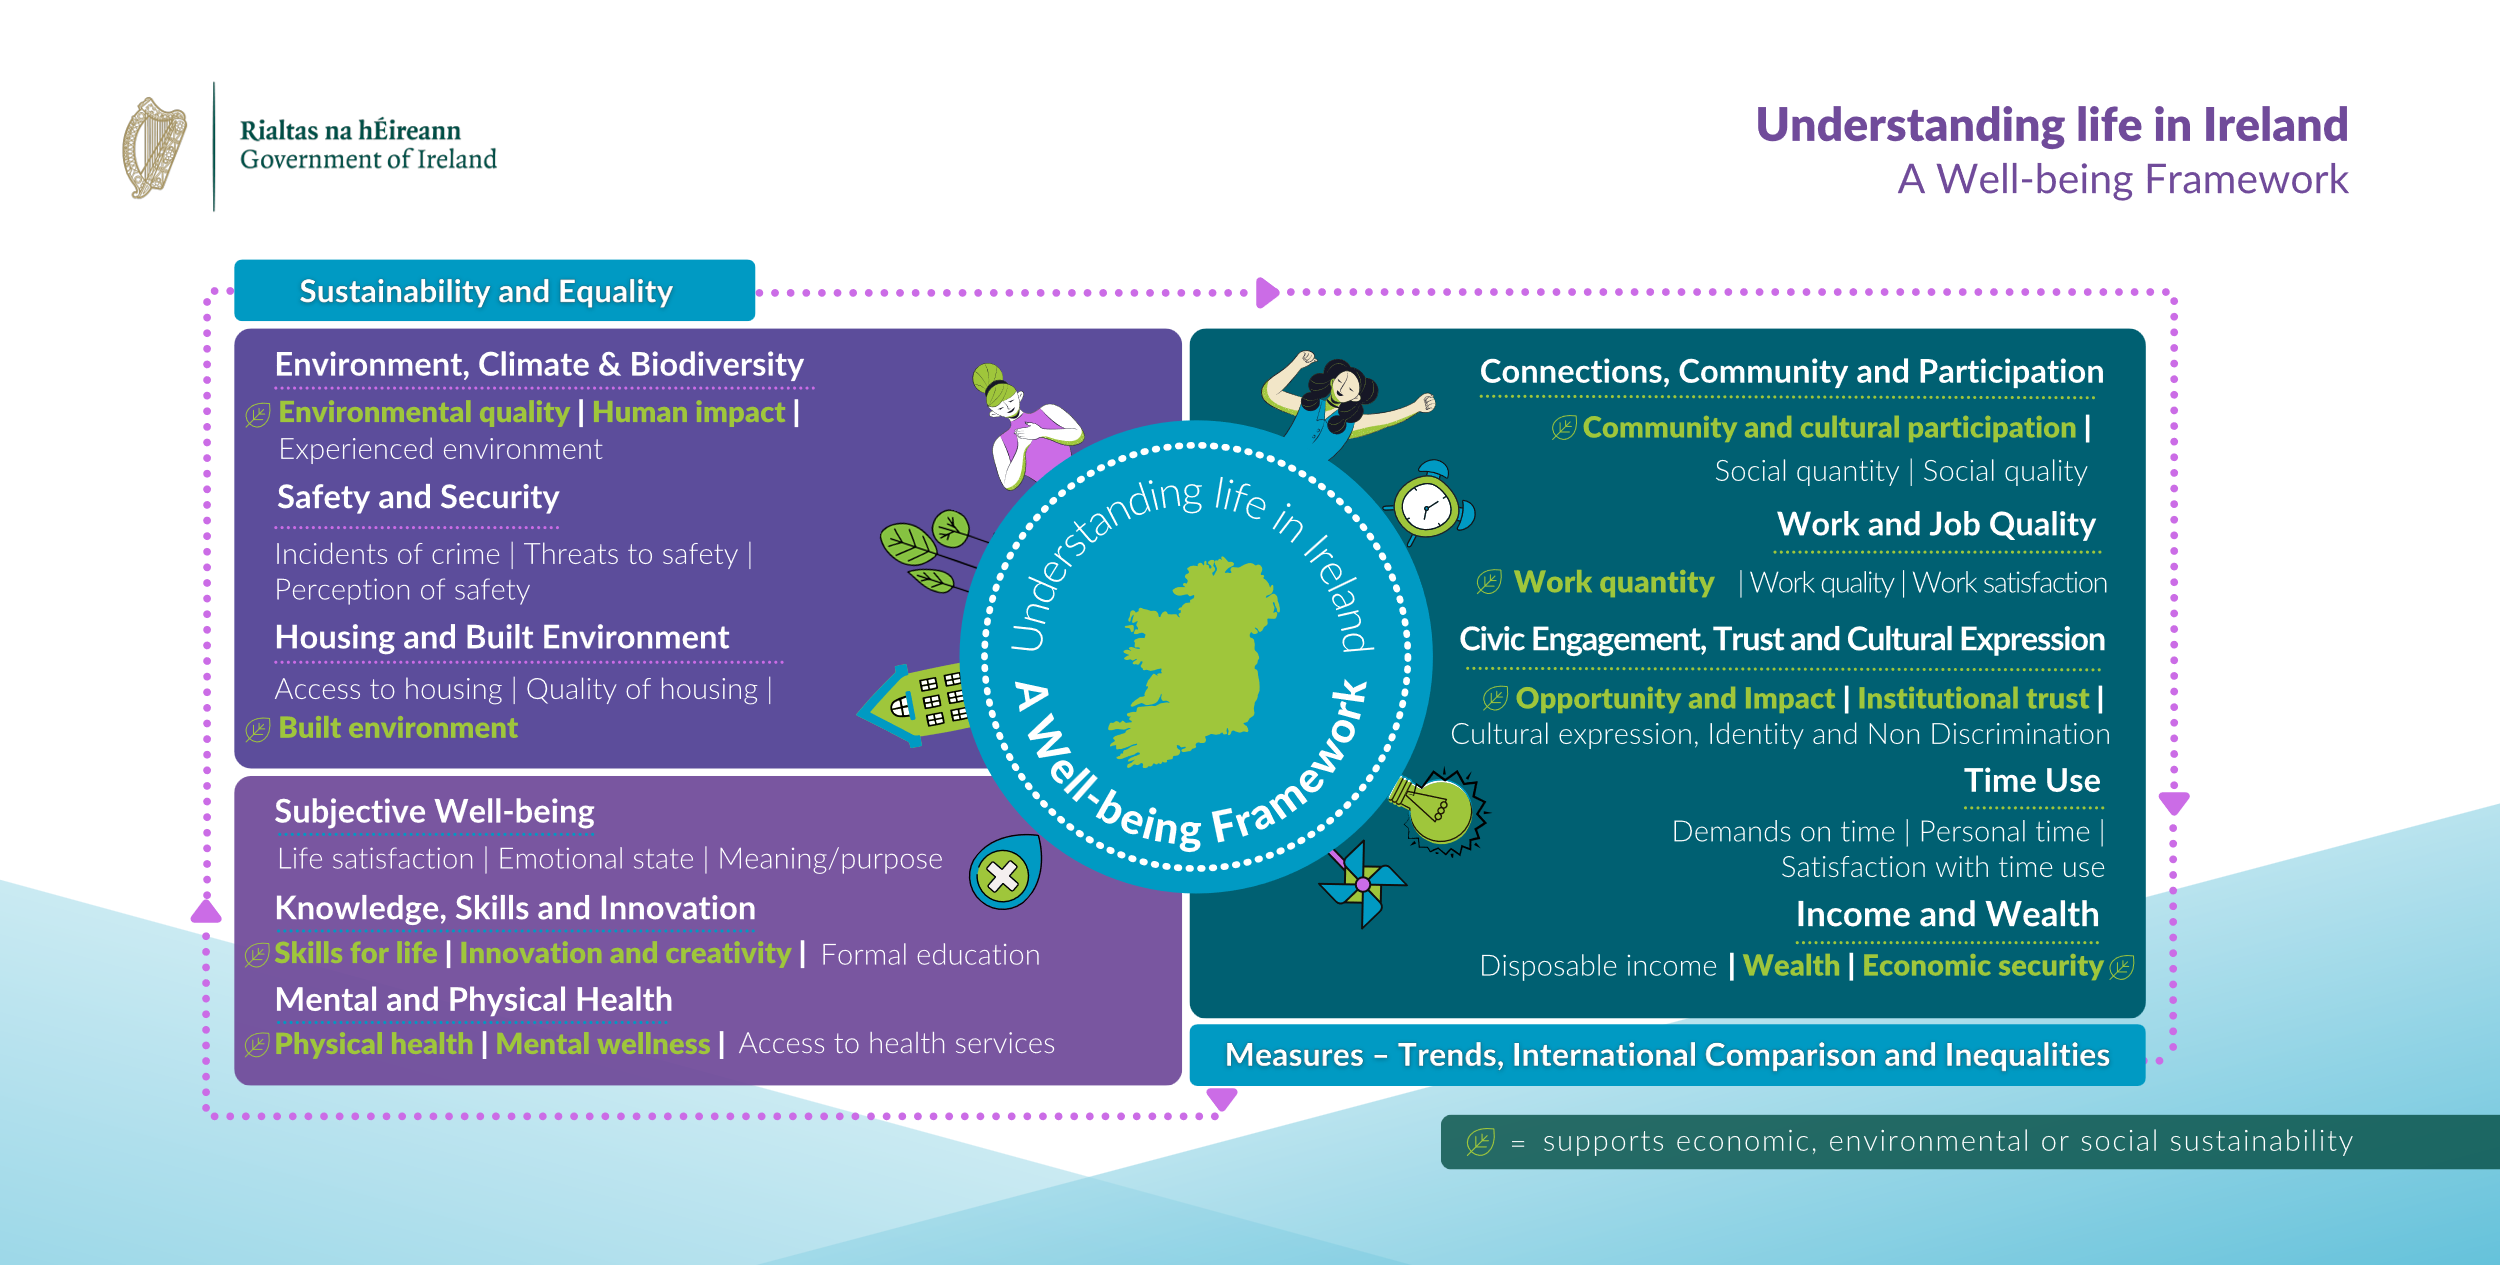 Source: (CSO, 2023)
The Well-being Framework for Ireland is integrated into the Budgetary cycle to assist in expenditure decision-making. This includes a budget tagging initiative, which provides a whole-of-government perspective on expenditure using the Framework to better understand the intended impact of Government expenditures on behalf of the public. Work is ongoing across Government to use the Framework to improve performance measurement, support policy analysis, and better understand the impact of Government on quality of life.
Source: (CSO, 2023)
The Well-being Framework for Ireland is integrated into the Budgetary cycle to assist in expenditure decision-making. This includes a budget tagging initiative, which provides a whole-of-government perspective on expenditure using the Framework to better understand the intended impact of Government expenditures on behalf of the public. Work is ongoing across Government to use the Framework to improve performance measurement, support policy analysis, and better understand the impact of Government on quality of life.
Box 2.7
Case study – Italy’s Equitable and Sustainable Well-being (BES) Indicators
Case study – Italy’s Equitable and Sustainable Well-being (BES) Indicators
Italy’s Equitable and Sustainable Well-being indicators, referred to as the ‘BES’ indicators for the Italian acronym (Benessere Equo e Sostenibile), are managed by the Italian national statistical office (ISTAT). The indicators have been presented in an annual report since 2013, and a shorter set of (headline) indicators has been featured in parliamentary reporting and budgetary analysis since 2017. The current BES indicator set features 152 indicators across 12 dimensions of well-being: health; education and training; work-life balance; economic well-being; social relationships; politics and institutions; safety; subjective well-being; landscape and cultural heritage; environment; innovation, research and creativity; and quality of services.
Widespread consultation helped inform the development of the Framework and selection of indicators. A steering group on ‘Measurement of Progress in Italian Society’ was established to identify relevant well-being domains in Italy, including representatives of entrepreneurs, professional associations, trade unions, environmental groups, cultural heritage groups, women's groups, consumer protection groups and civil society networks. A Scientific Commission with 80 researchers and experts from ISTAT, universities and other institutions was also established to consult on indicator selection. Moreover, a representative survey of the Italian population was conducted (about 45,000 people interviewed), inquiring which dimensions are important for well-being. This was further supported by a dedicated website, a blog and an online survey to consult with the public on the Steering Group’s and Scientific Commission’s decisions (approximately 2,500 respondents). After the publication of the first report in 2013, the initiative was presented in a series of regional public meetings.
In 2016, a reform to government accounting required the Ministry of Economy and Finance to report to Parliament twice a year on the evolution of headline BES indicators and the actual or projected impact of different budget scenarios (through a monitoring report every February, as well as an Annex to the Economic and Financial Planning document – the Italian government’s main financial and economic planning instrument – every April). Twelve indicators from the entire BES set were selected by an Expert Committee in 2017 to underpin these reports: adjusted gross disposable income per capita; disposable income inequality; absolute poverty rate; healthy life expectancy at birth; overweight or obesity rate; early leavers from education and training; non-participation rate; ratio of employment rate for women aged 25-49 with at least one child aged 0-5 to the employment rate of women 25-49 years without children; predatory crime index; length of civil proceedings; emissions of CO2 and other greenhouse gases; and the illegal building rate. The 2017 Economic and Finance Document (DEF) included four of these indicators, and all 12 were included in the 2018 DEF for the first time. Since then, cross-departmental efforts (led by the Ministry of Economy and Finance) have continued to refine the budgetary reporting on the 12 indicators.
Source: (ISTAT, 2021; Italian Ministry of Economy and Finance, 2023)
Box 2.8
Improvements in data infrastructure - the System of National Accounts
Improvements in data infrastructure - the System of National Accounts
The System of National Accounts (SNA) is an internationally agreed statistical framework that provides a comprehensive and consistent set of macroeconomic accounts for policymaking, analysis and research purposes. A range of internationally comparable aggregate measures of economic well-being, such as household income, consumption and wealth are already available in the sequence of economic accounts within the SNA production boundary (excluding the value of activities beyond this boundary that may affect well-being, such as the value of households’ production of services for own consumption). The SNA also includes information on government expenditures in areas relevant to people’s well-being, such as justice, infrastructure, public transport, health and education – but it does not provide information on whether well-being has improved after the consumption of these goods and services.
The 2025 SNA will provide greater visibility for the digital economy and free digital services, as well as include data as a new and separate product category in the core accounts. It will also encourage countries to produce complementary estimates of GDP and gross household disposable income that include unpaid household activities and to produce household sector distributions of income, consumption and wealth. Finally, in the 2025 SNA, depletion of natural capital will be included in net measures of production and income. This will indicate whether current economic activity is occurring at the expense of natural capital stocks, which might affect future economic performance and welfare.
Relatedly, in 2024, the United Nations’ Network of Economic Statisticians presented a roadmap for the development of a ‘System of Population and Social Statistics’ and a ‘Framework for Inclusive and Sustainable Well-being’ to the United Nations Statistical Commission. The System of Population and Social Statistics might be seen as an addition to the SNA and the System of Environmental and Economic Accounting (SEEA, which is the international statistical standard for measuring the environment and its relationship with the economy), focusing on population and social statistics. It should represent a system-wide agreement of concepts, definitions, and structures to measure demographic and social developments.
Source: (UN Stats, 2024)
|
Principle 3. Indicators in well-being frameworks are outcome-focused and include both objective and subjective assessments of people’s circumstances
|
2.26 The third common principle across well-being initiatives relates to the focus and coverage of their indicator sets. The dashboards often concentrate, where possible, on measuring well-being outcomes (aspects of life that are directly and intrinsically important to people), rather than the inputs and outputs that might be used to deliver those outcomes (for example, skills and competencies achieved vs the money spent on schools or the number of teachers trained) (OECD, 2017). This is because outcomes may be imperfectly correlated with inputs (e.g. health expenditure may be a poor predictor of health status if the health care system is inefficient) or outputs (e.g. the number of surgical interventions performed may say little about people’s health conditions).
2.27 In addition, following the Stiglitz-Sen-Fitoussi Report’s recommendation to provide information on how people experience their lives, many dashboards complement objective (i.e., observable by a third party) data on living conditions and quality of life6 with at least some indicators capturing a person’s own evaluation and feelings about her or his circumstances. Such subjective indicators include both aspects of subjective well-being (defined as “good mental states, including all of the various evaluations, positive and negative, that people make of their lives and the affective reactions of people to their experiences” (OECD, 2013)) and broader perception-based and self-reported indicators (e.g. how safe people feel, how easy or difficult they perceive it to get by financially, how much they trust their government, or, how socially connected they report to be).
2.28 A 2023 review of measurement of current well-being conducted by the Bureau of the Conference of European Statisticians (CES) found that CES Members are using both objective and subjective well-being indicators (UNECE, 2023). Similarly, a recent mapping of national well-being frameworks across OECD countries shows that about 90 per cent include a core measure of overall subjective well-being and many include indicators for life evaluation, affect and eudaimonia, as illustrated in Figure 2.9 (Mahoney, 2023). The mapping also showed that many feature questions on ‘domain satisfaction’, i.e., asking respondents how satisfied they are with different aspects of their lives, such as housing, their job, or their health. Half of national well-being initiatives in OECD countries also include an indicator of how socially supported people feel, and just under half a measure of feeling lonely (OECD, 2024). Box 2.9 illustrates how Israel’s well-being dashboard has incorporated both objective and subjective indicators.
Figure 2.9
Subjective well-being indicators in national frameworks
Subjective well-being indicators in national frameworks
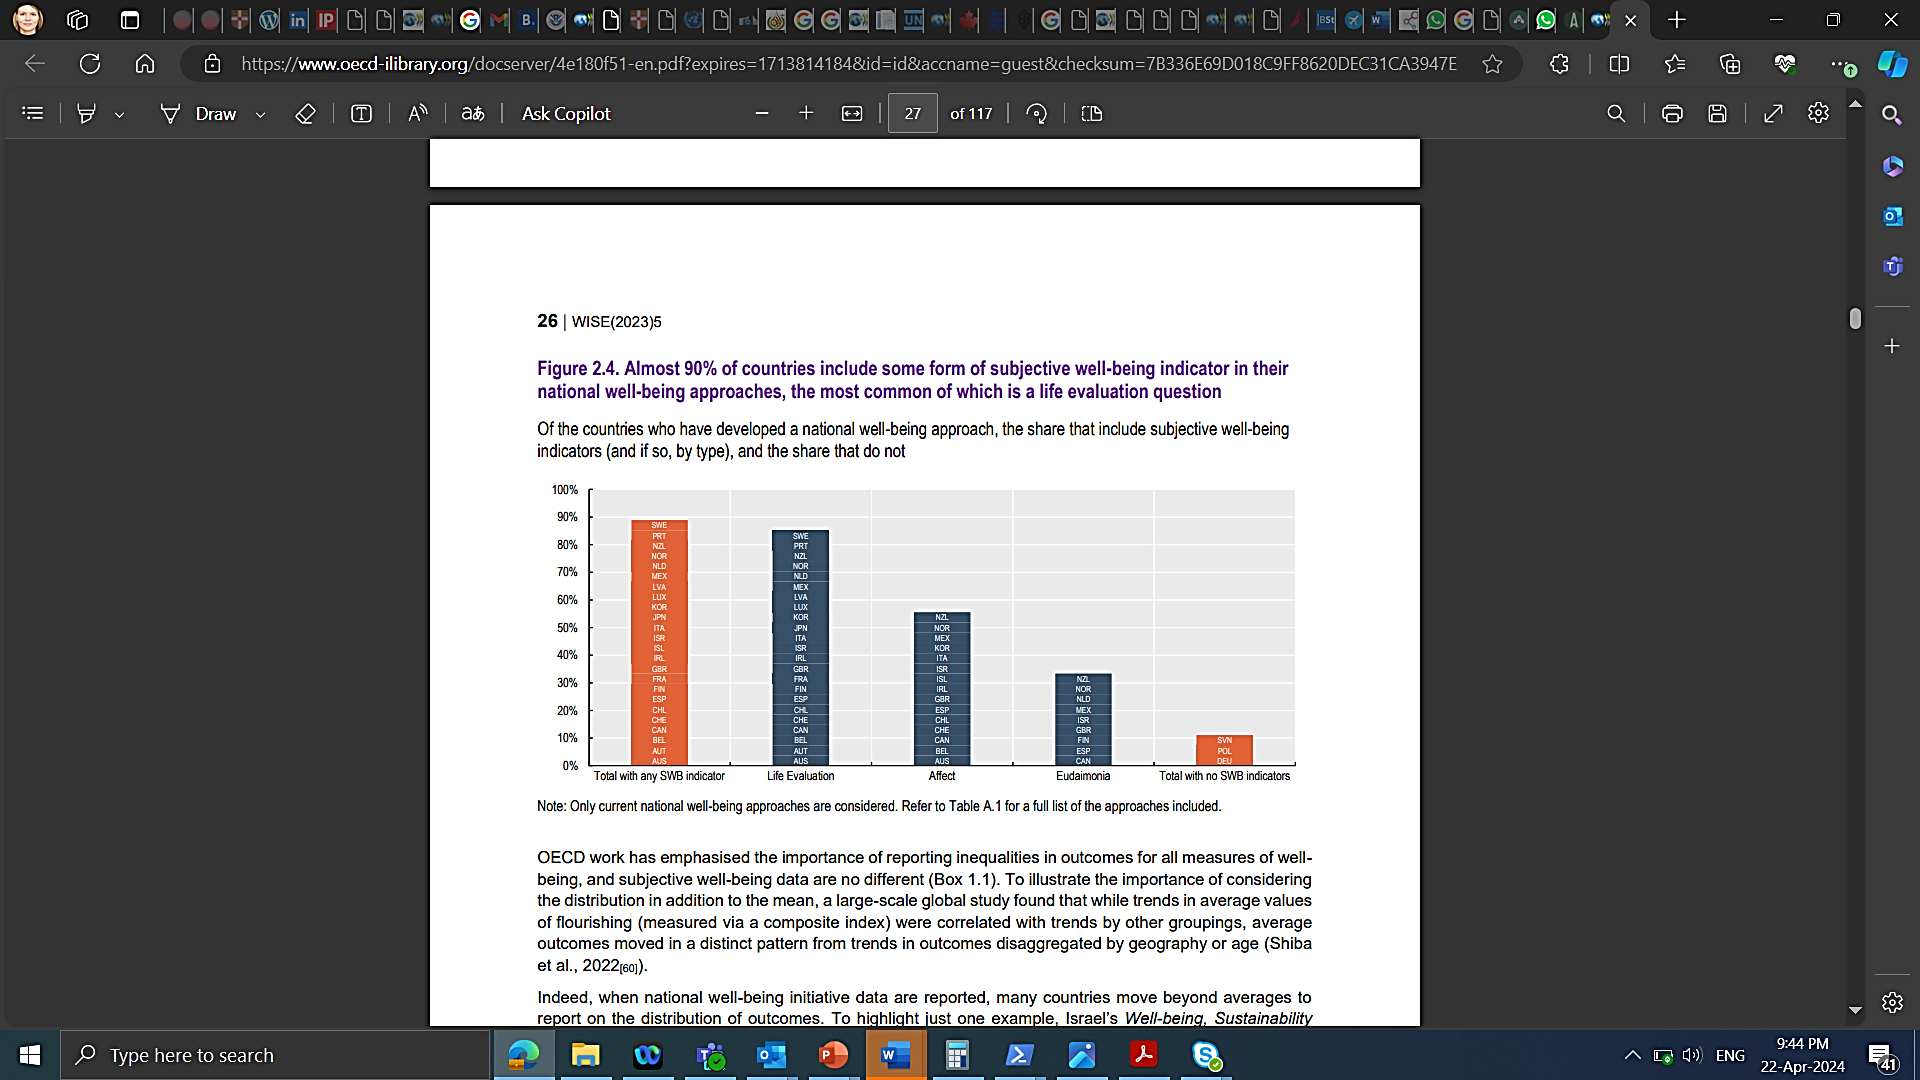
Source: Mahoney, 2023
Box 2.9
Case study – Israel’s Well-being, Sustainability and National Resilience Indicators
Case study – Israel’s Well-being, Sustainability and National Resilience Indicators
Under the resolution adopted by the government of Israel in April 2015, the Israeli Central Bureau of Statistics (CBS) is responsible for developing, reporting and updating indicators of well-being to complement data on economic growth and provide a more comprehensive and multi-dimensional assessment of well-being and quality of life of the population. The development of the well-being dashboard began in 2012, led by the Prime Minister's Office, the National Economic Council and the Ministry of Environmental Protection, and involved discussions among different ministries, academia, Non-Governmental Organisations (NGOs) and the private sector, as well as (online) public consultations and focus groups.
Israel’s well-being indicators span 11 dimensions (quality of employment, personal security, health, housing and infrastructure, education and skills, civic engagement and governance, environment, personal and social well-being, material standard of living, leisure culture and community, information and communication technology) and draw on both administrative and survey data. The indicators provide a basis for examining changes in well-being in Israel, comparing well-being of different population groups and with other countries.
Building on the Stiglitz report (2009) and the OECD Well-being Framework, Israel used a range of criteria for indicator selection: the individual perspective; emphasis on outcomes; inclusion of distributional indicators where possible; agreed desired direction of progress; a balanced use of objective and subjective indicators; and policy relevance (see Figure 2.10)
Figure 2.10
Objective and subjective indicators in the quality of employment dimension
Objective and subjective indicators in the quality of employment dimension
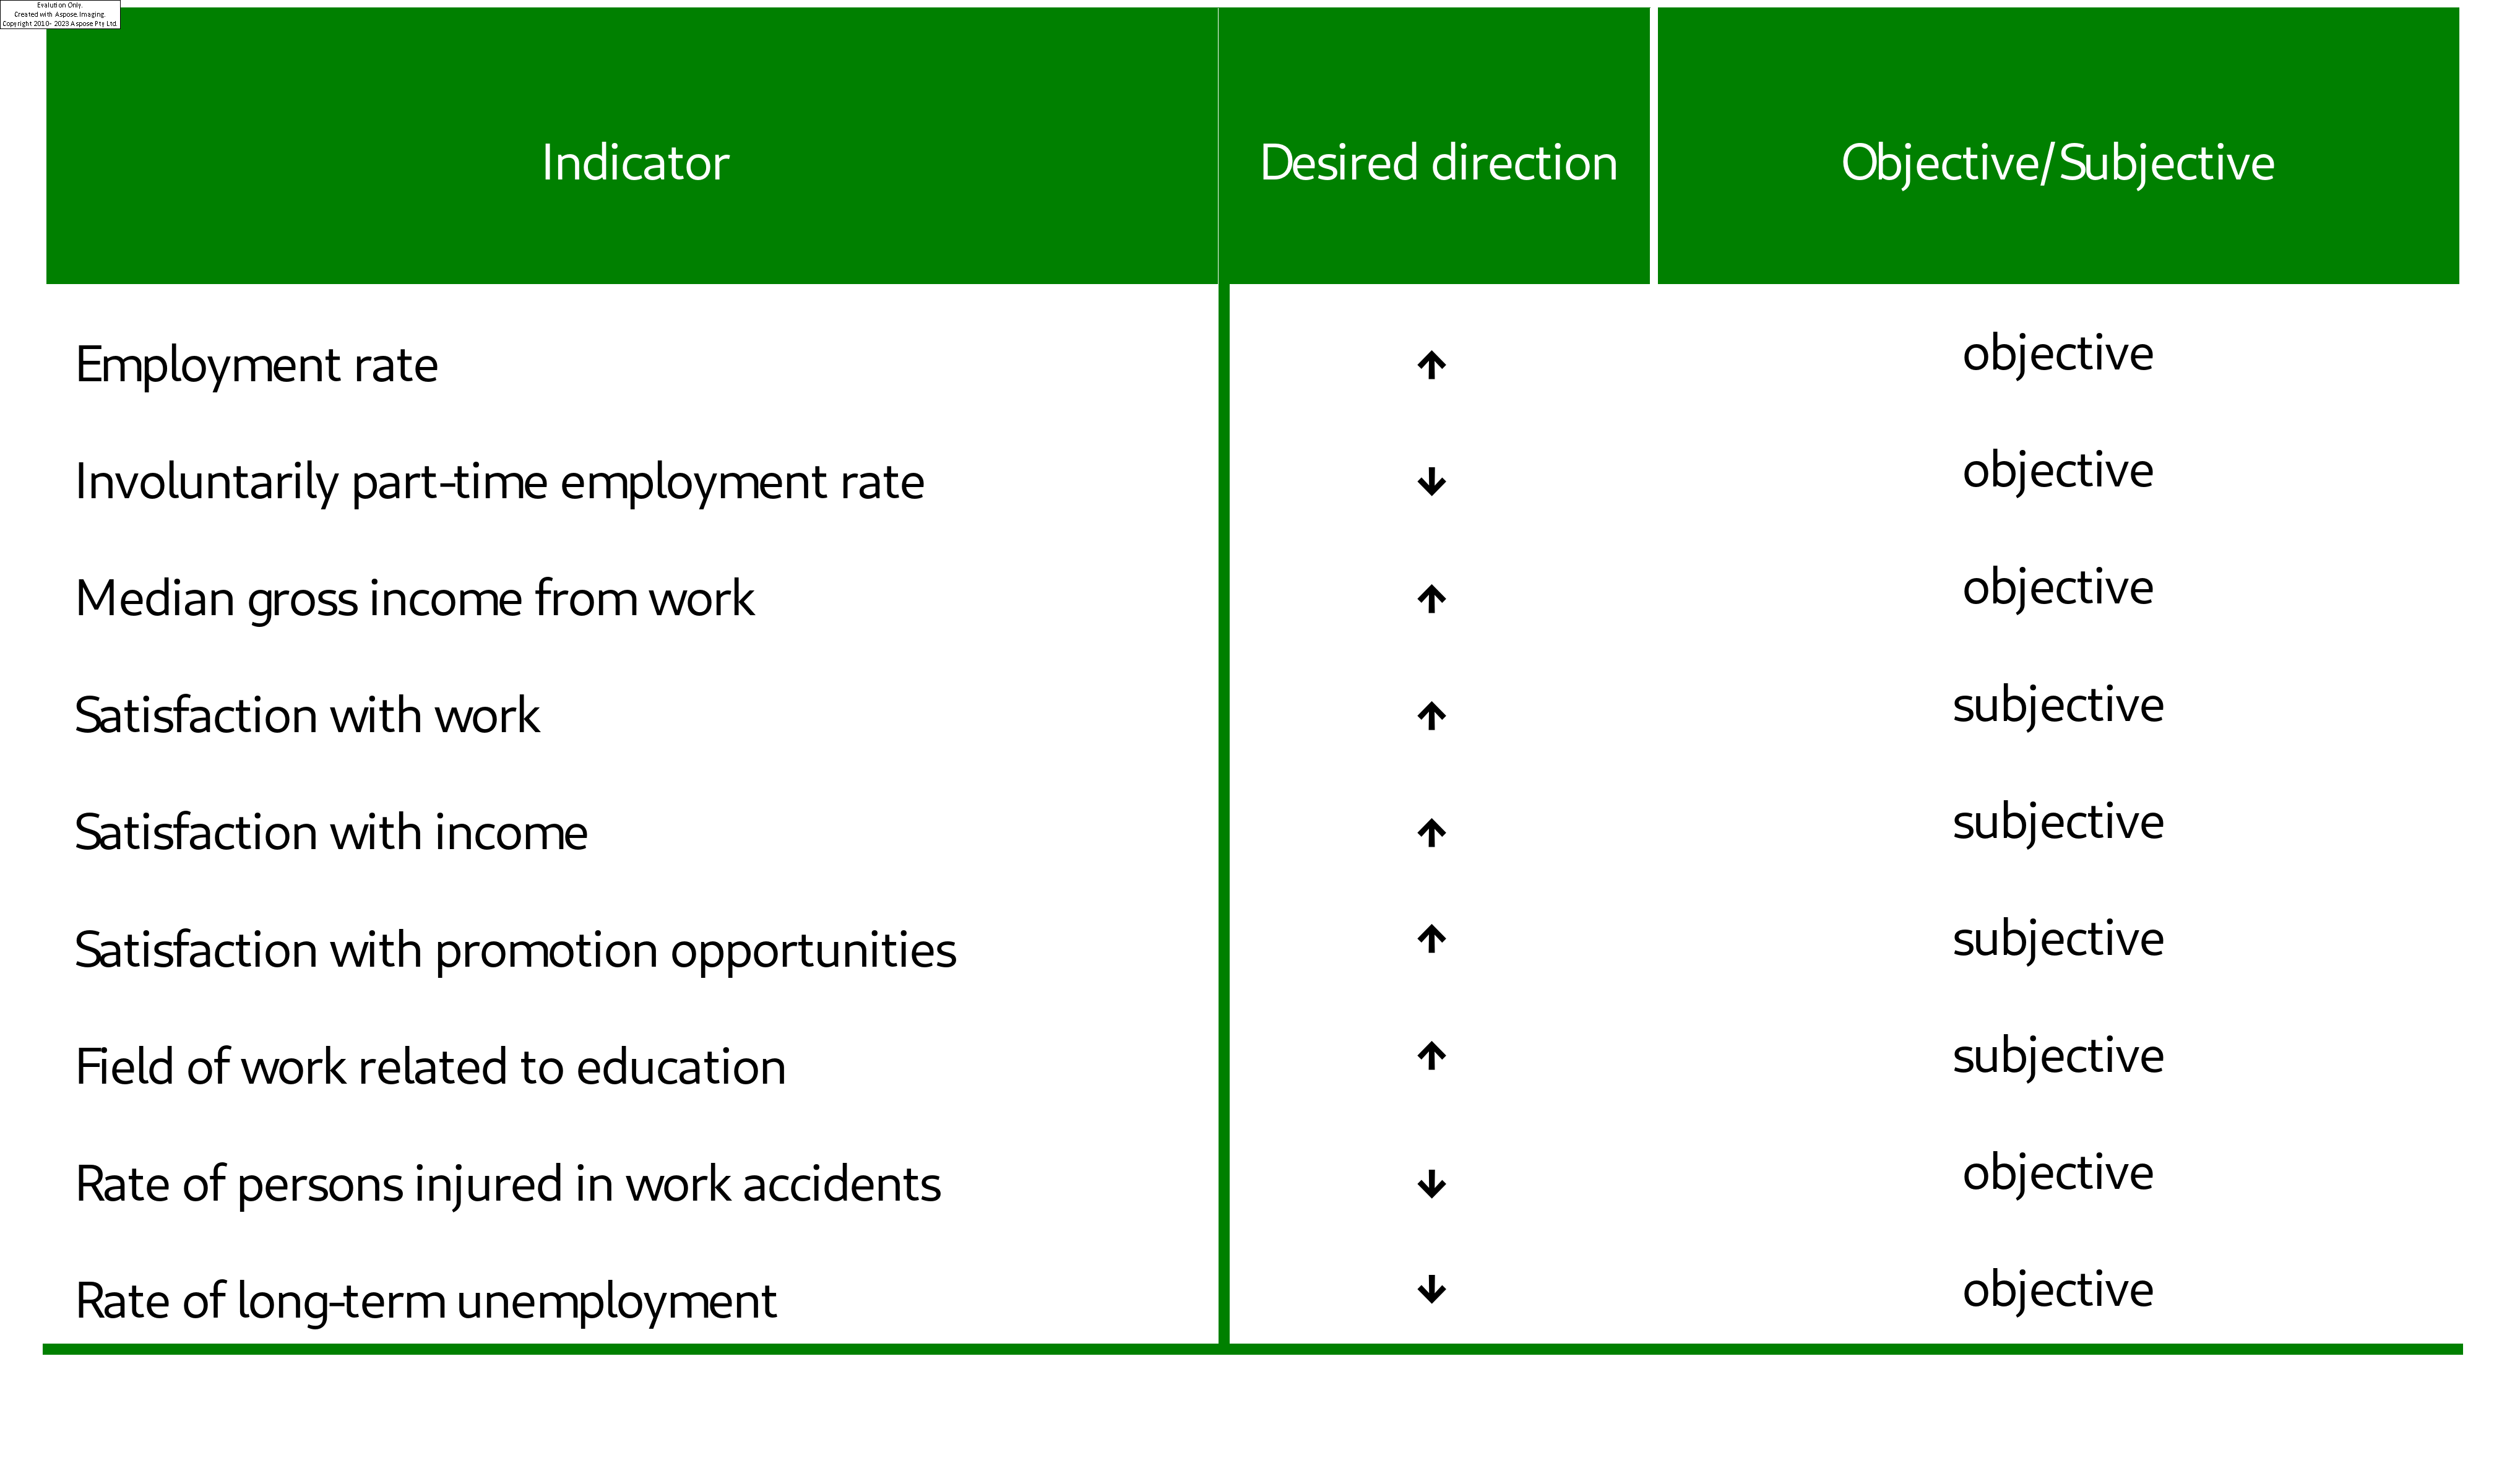 Source: (CBS, 2016)