

Chapter 3 Dimensions and Indicators
 3.1 The aim of this chapter is to provide a set of common dimensions that provide a comprehensive representation of well-being and a list of recommended indicators for each dimension. The chapter synthesizes the list of dimensions and indicators of well-being based on the frameworks that are considered authoritative and form the foundation of efforts to work towards a global Framework on Inclusive and Sustainable Development (FISW) (United Nations 2024). These frameworks and associated dashboards are the report of Stiglitz, Sen and Fitoussi (2009), the CES Recommendations on Measuring Sustainable Development (2014), the OECD Well-being Framework (2011), and Eurostat’s Quality of Life framework (2016).
3.2 Section 3.1 outlines the scope of a framework for measuring well-being and defines key concepts. Section 3.2 describes the dimensions of well-being in the main international frameworks and presents a set of common dimensions. Section 3.3 provides guidance and criteria for the selection of indicators and recommends key indicators for each dimension of well-being. Section 3.4 takes a more detailed look at how to measure the distribution of well-being among population groups. Throughout, ‘well-being’ refers to well-being ‘here and now’, unless otherwise stated.
3.1 The aim of this chapter is to provide a set of common dimensions that provide a comprehensive representation of well-being and a list of recommended indicators for each dimension. The chapter synthesizes the list of dimensions and indicators of well-being based on the frameworks that are considered authoritative and form the foundation of efforts to work towards a global Framework on Inclusive and Sustainable Development (FISW) (United Nations 2024). These frameworks and associated dashboards are the report of Stiglitz, Sen and Fitoussi (2009), the CES Recommendations on Measuring Sustainable Development (2014), the OECD Well-being Framework (2011), and Eurostat’s Quality of Life framework (2016).
3.2 Section 3.1 outlines the scope of a framework for measuring well-being and defines key concepts. Section 3.2 describes the dimensions of well-being in the main international frameworks and presents a set of common dimensions. Section 3.3 provides guidance and criteria for the selection of indicators and recommends key indicators for each dimension of well-being. Section 3.4 takes a more detailed look at how to measure the distribution of well-being among population groups. Throughout, ‘well-being’ refers to well-being ‘here and now’, unless otherwise stated.
 3.1 Scope
3.3 Measurement of well-being focuses on outcomes, aspects of life that are directly and intrinsically important to people, such as life satisfaction, health, or employment. The inputs and outputs that might be used to deliver those outcomes (for example, the money spent on schools or the number of teachers, versus the outcome in terms of skills and competencies) are typically not included, because outcomes may be imperfectly correlated with inputs (e.g. health expenditure may be a poor predictor of health status if the health care system is inefficient) or outputs (e.g. the number of surgical interventions performed may say little about people’s health conditions) (OECD, 2017; see Chapter 2).
3.4 However, the distinction between outcomes and inputs is not as sharp as this suggests. It is not always possible to unambiguously determine whether something is an outcome or an input. For example, employment may be an outcome for some people, an input for others. In other cases, outcome indicators may not be available, and one may decide to rely on available input or output indicators. Hence, while the focus is on outcomes, the Guidelines include input and output indicators. In addition, there are different cultural interpretations of the factors that determine well-being, for example, with respect to the role of family, community, and nature.
3.5 Current and future well-being consists of different dimensions and requires different types of indicators. Current well-being concerns the outcomes in various aspects of quality of life, such as health or work. The dimensions of future well-being relate to the resources (or ‘capitals’) that people use to shape their lives. When the current generation diminishes economic, natural, human and social capital, future generations will not be able to achieve the same level of well-being (UNECE 2014). Future well-being is measured using indicators for the stocks of economic, natural, human and social capital (OECD 2013a; UNECE 2014). Current well-being is measured using indicators for the outcomes jointly produced using these capitals.
3.6 For example, wealth is a private resource that people can use to improve their current well-being. When used (e.g. when people withdraw savings to go on an extended holiday), this will show up as consumption. When wealth is collateral (e.g. to acquire a mortgage for a new house), the outcome is an improvement in housing or other living conditions. Wealth is a stock (a capital) while its use shows up as a flow in current well-being. People experience the benefits of strong public institutions, social cohesion and cultural traditions, rich biodiversity, a beautiful landscape, and a liveable biosphere in the present, for example, in better health outcomes, clean air, safe neighbourhoods, higher life satisfaction, and feelings of meaning and purpose. The degree to which resources can be sustained determines if future generations can reap the same benefits. This requires indicators for the quantity and quality of capital stocks. In practice, many of the international and national well-being frameworks do include ’stock’ indicators (see Chapter 2).
3.7 In these Guidelines, the focus is on human well-being. This does not mean that humans stand at the centre. There exists a wide range of views on inclusive and sustainable well-being. Some cultures see material well-being as a necessary precondition for immaterial well-being, while others feel that nature and community are more important than the economy, and that humans are merely one of the species that share the Earth. Statistics on well-being should be impartial. Normative valuations should be left to the users of the statistics (see section 3.4).
3.8 The measurement of well-being should be inclusive. In principle, statistics should cover all people living in a country or region, regardless of their citizenship, age, religion, or other characteristics. This is why statistics on the distribution of well-being form an integral part of the measurement of well-being. Measuring well-being indicators among different population groups or different areas (not only between but also within countries) is also an important tool to keep track of the evolution of inequalities.
3.2 Common dimensions
3.9 This Section aims to synthesize the dimensions in key international frameworks of well-being (Box 3.1). A dimension is a specific aspect of well-being. The set of dimensions should be comprehensive, aspiring to cover all aspects of well-being, and each dimension should represent a meaningful part of the way people live their lives. The dimensions represent a classification of relevant aspects of well-being for statistical measurement. Dimensions are interrelated. For example, environmental conditions may impact health, while health influences subjective well-being.
3.10 The dimensions should be universal, common to all countries.7 There are, however, cultural differences in the dimensions that matter to well-being and in their interpretation. The set of dimensions should be sufficiently broad in its scope and formulation to allow statisticians to make the necessary adaptations that are relevant to their nation, region, culture, or population group, while maintaining the comparability of the overall framework.
3.11 An NSO may distinguish subdimensions that capture specific relevant topics. A general idea of conceptually relevant subdimensions helps in selecting a balanced set of indicators (e.g. quantity versus quality of paid work). Some relevant subdimensions will be suggested in the list of recommended indicators (in section 3.3.4). Statistical producers can use these in a narrative of the statistical results. They can also add subdimensions that are specific to national requirements, such as cultural aspects or policy relevance.
3.2.1 Dimensions in existing frameworks
3.12 The starting point for identification of common dimensions of well-being is the frameworks that have been explored in chapter 2, i.e., (1) the report by Stiglitz, Sen and Fitoussi, (2) the CES Recommendations on Measuring Sustainable Development, (3) the OECD Well-being Framework, and (4) Eurostat’s Quality of Life framework.
3.13 Stiglitz, Sen and Fitoussi (2009) distinguish eight dimensions, namely material living standards (income, consumption and wealth); health; education; personal activities including work; political voice and governance; social connections and relationships; environment (present and future conditions); and insecurity, of an economic as well as a physical nature.
3.14 The CES Recommendations on Measuring Sustainable Development (UNECE 2014) divide current well-being into 14 dimensions: subjective well-being; consumption and income; nutrition; health; labour; education; housing; leisure; physical safety; land and ecosystems; water; air quality; trust; and institutions.
3.15 The OECD Well-being Framework (2011) comprises 11 dimension covering material conditions that shape people’s economic options, quality-of-life factors that encompass how well people are and feel, what they know and can do, and how healthy and safe they are, and community relations that encompass how connected and engaged people are. Material conditions include income and wealth; housing, and work and job quality. Quality-of-life factors include health, knowledge and skills, environmental quality, subjective well-being, and safety. Community relations include work-life balance, social connections, and civic engagement.
3.16 Eurostat’s Quality of Life framework (Eurostat, 2015) contains nine dimensions, of which eight dimensions relate to people’s capabilities to pursue their self-defined well-being according to their own values and priorities and one dimension, ‘overall experience of life’, refers to the personal perception of quality of life, namely life satisfaction, emotions, and sense of meaning and purpose of life (eudaimonia). The 8+1 dimensions are further broken down into topics and subtopics with their related indicators.
3.17 Box 3.1 compares the dimensions of well-being in the four frameworks and links the dimensions to statements in the Universal Declaration of Human Rights. Well-being and human rights fulfilment are intricately related. The UDHR represents a universally agreed-upon standard of human rights to which frameworks of well-being should be mappable.
3.18 Difference in language notwithstanding, the dimensions are in agreement, particularly around the broader themes of material conditions (income, consumption, housing), health, work, education, and physical safety.8
3.19 There are two stand-alone themes. Nutrition only occurs in the CES Recommendations. The theme was included because nutrition is a basic need and because a lack of nutrition (malnourishment) is a major issue for less developed countries. In other frameworks, nutrition is implicitly included in the dimension of health. Economic insecurity is suggested by Stiglitz-Sen-Fitoussi and is covered in the Universal Declaration of Human Rights, but it is not included as a separate theme in the other frameworks, although in the OECD Well-being Framework different indicators of economic insecurity are included within the income and wealth dimension, while Eurostat’s framework includes it in the same dimension as physical security.
3.1 Scope
3.3 Measurement of well-being focuses on outcomes, aspects of life that are directly and intrinsically important to people, such as life satisfaction, health, or employment. The inputs and outputs that might be used to deliver those outcomes (for example, the money spent on schools or the number of teachers, versus the outcome in terms of skills and competencies) are typically not included, because outcomes may be imperfectly correlated with inputs (e.g. health expenditure may be a poor predictor of health status if the health care system is inefficient) or outputs (e.g. the number of surgical interventions performed may say little about people’s health conditions) (OECD, 2017; see Chapter 2).
3.4 However, the distinction between outcomes and inputs is not as sharp as this suggests. It is not always possible to unambiguously determine whether something is an outcome or an input. For example, employment may be an outcome for some people, an input for others. In other cases, outcome indicators may not be available, and one may decide to rely on available input or output indicators. Hence, while the focus is on outcomes, the Guidelines include input and output indicators. In addition, there are different cultural interpretations of the factors that determine well-being, for example, with respect to the role of family, community, and nature.
3.5 Current and future well-being consists of different dimensions and requires different types of indicators. Current well-being concerns the outcomes in various aspects of quality of life, such as health or work. The dimensions of future well-being relate to the resources (or ‘capitals’) that people use to shape their lives. When the current generation diminishes economic, natural, human and social capital, future generations will not be able to achieve the same level of well-being (UNECE 2014). Future well-being is measured using indicators for the stocks of economic, natural, human and social capital (OECD 2013a; UNECE 2014). Current well-being is measured using indicators for the outcomes jointly produced using these capitals.
3.6 For example, wealth is a private resource that people can use to improve their current well-being. When used (e.g. when people withdraw savings to go on an extended holiday), this will show up as consumption. When wealth is collateral (e.g. to acquire a mortgage for a new house), the outcome is an improvement in housing or other living conditions. Wealth is a stock (a capital) while its use shows up as a flow in current well-being. People experience the benefits of strong public institutions, social cohesion and cultural traditions, rich biodiversity, a beautiful landscape, and a liveable biosphere in the present, for example, in better health outcomes, clean air, safe neighbourhoods, higher life satisfaction, and feelings of meaning and purpose. The degree to which resources can be sustained determines if future generations can reap the same benefits. This requires indicators for the quantity and quality of capital stocks. In practice, many of the international and national well-being frameworks do include ’stock’ indicators (see Chapter 2).
3.7 In these Guidelines, the focus is on human well-being. This does not mean that humans stand at the centre. There exists a wide range of views on inclusive and sustainable well-being. Some cultures see material well-being as a necessary precondition for immaterial well-being, while others feel that nature and community are more important than the economy, and that humans are merely one of the species that share the Earth. Statistics on well-being should be impartial. Normative valuations should be left to the users of the statistics (see section 3.4).
3.8 The measurement of well-being should be inclusive. In principle, statistics should cover all people living in a country or region, regardless of their citizenship, age, religion, or other characteristics. This is why statistics on the distribution of well-being form an integral part of the measurement of well-being. Measuring well-being indicators among different population groups or different areas (not only between but also within countries) is also an important tool to keep track of the evolution of inequalities.
3.2 Common dimensions
3.9 This Section aims to synthesize the dimensions in key international frameworks of well-being (Box 3.1). A dimension is a specific aspect of well-being. The set of dimensions should be comprehensive, aspiring to cover all aspects of well-being, and each dimension should represent a meaningful part of the way people live their lives. The dimensions represent a classification of relevant aspects of well-being for statistical measurement. Dimensions are interrelated. For example, environmental conditions may impact health, while health influences subjective well-being.
3.10 The dimensions should be universal, common to all countries.7 There are, however, cultural differences in the dimensions that matter to well-being and in their interpretation. The set of dimensions should be sufficiently broad in its scope and formulation to allow statisticians to make the necessary adaptations that are relevant to their nation, region, culture, or population group, while maintaining the comparability of the overall framework.
3.11 An NSO may distinguish subdimensions that capture specific relevant topics. A general idea of conceptually relevant subdimensions helps in selecting a balanced set of indicators (e.g. quantity versus quality of paid work). Some relevant subdimensions will be suggested in the list of recommended indicators (in section 3.3.4). Statistical producers can use these in a narrative of the statistical results. They can also add subdimensions that are specific to national requirements, such as cultural aspects or policy relevance.
3.2.1 Dimensions in existing frameworks
3.12 The starting point for identification of common dimensions of well-being is the frameworks that have been explored in chapter 2, i.e., (1) the report by Stiglitz, Sen and Fitoussi, (2) the CES Recommendations on Measuring Sustainable Development, (3) the OECD Well-being Framework, and (4) Eurostat’s Quality of Life framework.
3.13 Stiglitz, Sen and Fitoussi (2009) distinguish eight dimensions, namely material living standards (income, consumption and wealth); health; education; personal activities including work; political voice and governance; social connections and relationships; environment (present and future conditions); and insecurity, of an economic as well as a physical nature.
3.14 The CES Recommendations on Measuring Sustainable Development (UNECE 2014) divide current well-being into 14 dimensions: subjective well-being; consumption and income; nutrition; health; labour; education; housing; leisure; physical safety; land and ecosystems; water; air quality; trust; and institutions.
3.15 The OECD Well-being Framework (2011) comprises 11 dimension covering material conditions that shape people’s economic options, quality-of-life factors that encompass how well people are and feel, what they know and can do, and how healthy and safe they are, and community relations that encompass how connected and engaged people are. Material conditions include income and wealth; housing, and work and job quality. Quality-of-life factors include health, knowledge and skills, environmental quality, subjective well-being, and safety. Community relations include work-life balance, social connections, and civic engagement.
3.16 Eurostat’s Quality of Life framework (Eurostat, 2015) contains nine dimensions, of which eight dimensions relate to people’s capabilities to pursue their self-defined well-being according to their own values and priorities and one dimension, ‘overall experience of life’, refers to the personal perception of quality of life, namely life satisfaction, emotions, and sense of meaning and purpose of life (eudaimonia). The 8+1 dimensions are further broken down into topics and subtopics with their related indicators.
3.17 Box 3.1 compares the dimensions of well-being in the four frameworks and links the dimensions to statements in the Universal Declaration of Human Rights. Well-being and human rights fulfilment are intricately related. The UDHR represents a universally agreed-upon standard of human rights to which frameworks of well-being should be mappable.
3.18 Difference in language notwithstanding, the dimensions are in agreement, particularly around the broader themes of material conditions (income, consumption, housing), health, work, education, and physical safety.8
3.19 There are two stand-alone themes. Nutrition only occurs in the CES Recommendations. The theme was included because nutrition is a basic need and because a lack of nutrition (malnourishment) is a major issue for less developed countries. In other frameworks, nutrition is implicitly included in the dimension of health. Economic insecurity is suggested by Stiglitz-Sen-Fitoussi and is covered in the Universal Declaration of Human Rights, but it is not included as a separate theme in the other frameworks, although in the OECD Well-being Framework different indicators of economic insecurity are included within the income and wealth dimension, while Eurostat’s framework includes it in the same dimension as physical security.
Box 3.1
Common dimensions in international well-being frameworks
Common dimensions in international well-being frameworks
|
Stiglitz, Sen, Fitoussi
|
CES
Recommendations
|
OECD Well-being Framework
|
Eurostat Quality of Life framework
|
UN Universal Declaration of Human Rights
|
|
subjective well-being
|
subjective well-being
|
overall experience of life
|
economic, social and cultural rights indispensable for his dignity and the free development of his personality (art. 22)
|
|
|
material living standards
|
consumption and income
|
income and wealth
|
material living conditions (income and consumption
|
a standard of living adequate for health and well-being of himself and of his family (art. 25), right to own property (art. 17)
|
|
nutrition
|
food (art. 25)
|
|||
|
health
|
health
|
health
|
health
|
health (art. 25)
|
|
personal activities (work)
|
labour
|
work and job quality
|
productive or other main activity
|
no slavery or servitude (art. 4), right to work, free choice of employment, just and favourable conditions of work and protection against unemployment (art. 23)
|
|
education
|
education
|
knowledge and skills
|
education
|
education (art. 26)
|
|
housing
|
housing
|
material living conditions (housing)
|
housing (art. 25)
|
|
|
personal activities (other than work)
|
leisure
|
work-life balance
|
leisure and social interactions (leisure)
|
rest and leisure (art. 24)
|
|
insecurity (physical)
|
physical safety
|
safety
|
economic and physical safety (physical and personal security)
|
right to life, liberty and security of person (art. 3), no torture, inhuman or degrading treatment or punishment (art. 5)
|
|
insecurity (economic)
|
economic and physical safety (economic security and vulnerability)
|
right to social security (art. 22), right to security in the event of […] lack of livelihood in circumstances beyond his control (art. 25)
|
||
|
environment (present conditions)
|
land and ecosystems
water
air
|
environmental quality
|
natural and living environment
|
While the right to a clean environment is not specified in the UDHR, the human right to a healthy environment is clearly stated in international human rights law.
|
|
social connections and relationships
|
trust
|
social connections
|
leisure and social interactions (social interactions)
|
right to marry and to found a family (art. 16), freely to participate in the cultural life of the community (art. 27), right to freedom of peaceful assembly and association (art. 20)
|
|
political voice and governance
|
institutions
|
civic engagement
|
governance and basic rights
|
legal protection clauses (art. 6 thru 12, 15), right to freedom of thought, conscience and religion (art. 18), right to freedom of opinion and expression (art. 19), right to take part in the government and right of equal access to public service (art. 21), duties to the community (art. 29)
|
Art.: Article
3.2.2 Recommended common dimensions
3.20 This section provides a list of common recommended dimensions that attempt to capture all aspects of well-being from a human perspective. The recommended dimensions synthesise the dimensions used in Stiglitz, Sen and Fitoussi, CES Recommendations on Measuring Sustainable Development, the OECD Well-being Framework and Eurostat’s Quality of Life framework. Each dimension represents a meaningful part of the way people live their lives. Together, the dimensions constitute a coherent whole.
3.21 There is no normative order or hierarchy in the dimensions. From the perspective of statistical measurement, each dimension is equally important. Users can make their own choices, depending on their own requirements, values, preferences, or other considerations. The recommended dimensions are listed in Box 3.2.
Box 3.2
Recommended common dimensions
Recommended common dimensions
|
1. Subjective well-being
2. Material living conditions
3. Work and leisure
4. Housing
5. Health
6. Knowledge and skills
7. Physical safety
8. Social connections
9. Civic engagement
10. Environmental conditions
|
3.22 Section 3.3.4 explains the relevance of each dimension for well-being and presents recommended indicators for the dimensions.
3.23 Statisticians should not be selective (cherry picking) concerning the dimensions that will or will not be measured. Well-being is a comprehensive, multidimensional concept. Each dimension represents a meaningful part of the way people live their lives. It might not always be possible to measure all dimensions. The preferred solution is to keep in place dimensions for which no indicators are available, but to highlight the absence of indicators. Nation-specific topics can be integrated into the framework by statistical producers, for example, by adding subdimensions to the common dimensions.
3.2.3 Country specific vs. internationally defined dimensions and indicators
3.24 Using indicators already featured in existing international data sets has several important advantages.
•
Data quality: Typically, these indicators will already have been subject to careful expert scrutiny, will have clear definitions and will be of the required quality.
•
Comparability: International harmonization will make it possible to compare aspects of well-being in a country with those of other countries. This enables each country to identify the areas in which it is already doing well and areas where others are doing better. This process of comparison can create important benchmarks or targets that can guide future prioritization to improve population well-being.
•
Credibility: The use of accepted international indicators can promote the idea that the well-being data is credible and that the reasons for choosing indicators are transparent. This may improve public perceptions of the ‘objectivity’ of the selection process.
3.25 There exists a number of databases of indicators that are validated and harmonized at the international level that are valuable starting points for building data set. These include:
•
SDG indicators
•
Human Development Reports (HDI)
•
OECD How’s life? Well-being Database
•
Eurostat database
•
World Bank data
•
International Labour Organization (ILO) data
•
UNICEF data and indicators
3.26 In addition to indicators from internationally comparable data sets, which in many cases draw on nationally produced data, countries may also have unique national data that is relevant for well-being measurement but not in all cases internationally harmonised. While not internationally comparable, such data may offer advantages:
•
Relevance and credibility: Based on a country's specific history, characteristics and needs, it might have developed unique data sets that are not internationally comparable but are important for the measurement of well-being in the national context. These data sets are often well-known and accepted by policymakers and users, which helps to maintain the credibility of a national measurement framework.
•
Disaggregation: Often country country-specific data will have been designed to allow disaggregation relevant to the specific national context. This may include appropriate regional classifications and disaggregation for key sub-groups. National data sets may also have included booster samples to ensure that there is sufficient data available for important sub-populations.
•
Availability and timeliness: National data sets tailored for a country's needs have the potential of being well-maintained and produced regularly. Additionally, there may be high-quality national data on topics that are not covered effectively in international data sets.
3.27 In the process of selecting the dimensions and indicators for a national framework for measuring well-being, it is recommended that internationally comparable data be integrated into national indicator sets to the extent possible. Additionally, countries should consider adding country-specific indicators that will make the measurement framework more relevant and useful at the national level.
3.3 Recommended indicators
3.28 An indicator is a statistical variable that provides an accurate and relevant representation of one aspect of a particular dimension of well-being. Since each indicator only measures one aspect of a dimension, providing a full picture requires a set of indicators. The recommended indicators are selected as first choices based on the criteria in Section 3.3.1.
3.29 These Guidelines apply some of the same principles as the UNECE Handbook on Measuring Quality of Employment and the OECD Guidelines on Measuring Subjective Well-being, Trust and Mental Health (UNECE 2015; OECD 2013b, 2017, 2023). The aim has been to make the Guidelines practical. Measurement of well-being ‘here and now’ should be within reach for all or most statistical offices.
3.30 Data availability in all countries has not been a criterion for selecting the recommended indicators. Some data sources may be available in one country but not in another. It may not be possible or efficient for all countries to produce the same indicators based on the same data sources. Rather, these Guidelines provide a comprehensive set of indicators that countries may draw from, considering their national circumstances and most suitable data sources. The list of recommended indicators specifies in which international frameworks the indicators are already used, indicating the availability of some internationally comparable data for these aspects.
3.3.1 Criteria for selecting indicators
3.31 National statistical offices and other statistical producers who develop indicator sets based on these Guidelines will have to consider the data that are available to them. Additionally, the decisions on the inclusion of indicators will depend on the properties of existing data sources, on the availability of resources for statistical production (in the short run and the long run), on national or local policy relevance, and other contextual factors. These Guidelines outline the principles that statistical producers should follow when selecting indicators. These criteria have been adapted from national practice and from the assessment criteria the OECD has applied to its well-being statistics, in turn based on a tailored version of the Quality Framework for OECD Statistical Activities (OECD 2019).
3.32 In Valuing What Counts (UN 2022), the UN proposed six criteria for the set of core metrics that go ‘beyond GDP’. The indicators should be comparable across time and countries, well-established and trusted; country owned; universally applicable; able to convey strong and clear messages that are actionable and intuitive; scientifically robust and statistically sound; and iterative and dynamic, based on what exists, while allowing for the addition of new indicators, as relevant.
3.33 When selecting indicators for measuring well-being, the following criteria (Czúcz 2021; OECD 2019; UN 2015) should be considered.
•
Timeliness and frequency: To remain relevant to policy makers and other users, indicators should be as current as possible and be updated periodically, preferably at least annually.
•
Credibility and comparability: The indicators should be reliable and reproducible. This means that they remain consistent and comparable (over time and between countries and regions). This is why indicators should be based on international definitions and classifications, where possible. They should be based on sound methodology, be scientifically robust, and have a proven track record.
•
Accuracy: Indicators must correctly reflect the underlying concepts that they are intended to capture (validity) and capture consistent information over time and across measurement vehicles (reliability).
•
Relevance: Indicators should reflect existing scientific understanding of well-being (intrinsic relevance) and should be related to well-being outcomes (instrumental relevance). Indicators may be selected because they are highly relevant for national (policy) discussions. Their intrinsic relevance for well-being should be clear. Such nationally relevant indicators should preferably be internationally comparable.
•
Directional meaning: It must be possible to interpret a change in the value of an indicator unambiguously. There should be consensus on whether an increase or decrease is favourable (or unfavourable) in terms of well-being.
•
Universality: The indicator should be reasonably applicable across countries, cultures, scales, and population groups.
•
Measurability: Indicators should be measurable. Regular and timely data collection can be done with reasonable cost and effort, using well-established sources of public and private data; recommended indicators should be within the capacity of most statistical offices. Indicators should be technically feasible to produce.
•
Disaggregation: It should be possible to disaggregate indicators by population group or region. The indicators are defined, as much as possible, independently of these categories (UNECE 2015).
•
Understandability: Indicators should be easy to understand, communicate and interpret.
3.34 While these inclusion criteria should be fulfilled to the extent possible, sometimes the ‘best possible available alternative’ must be selected, based on available data sources and to ensure balance across the well-being dimensions. All work on official statistics should adhere to the Fundamental Principles of Official Statistics.
3.3.2 Properties of the indicator set
3.35 A complex multidimensional phenomenon, such as well-being, requires a carefully composed, balanced set of indicators that properly describes all relevant aspects. The set of indicators should be comprehensive, covering, if possible, all dimensions of well-being, and balanced across dimensions (not too many indicators for one dimension and too few for another). The indicator set should contain both subjective and objective indicators. Indicators that are considered highly relevant but do not exist may be included in the set of indicators to signal a data gap with respect to a comprehensive suite of indicators.
3.36 When selecting the indicators, an important aspect to consider is their timeliness and frequency. Depending on the use of the indicators, the timeliness and frequency may be crucial, e.g., if a dashboard of indicators is meant to inform on-going policy decisions. If there is a need to improve timelines, NSOs may consider ways to reduce time lags in existing statistics and explore new and alternative data sources, including, e.g., social media, and compilation methods. The Guidelines recommend leveraging existing national and international data sources to ensure well-being indicators are updated more frequently, ideally at least annually.
3.3.3 Objective and subjective indicators
3.37 There is consensus that the indicator set should comprise both subjective and objective indicators, as recommended by Stiglitz, Sen & Fitoussi (2009, p. 16): “Measures of both objective and subjective well-being provide key information about people’s quality of life. Statistical offices should incorporate questions to capture people’s life evaluations, hedonic experiences and priorities in their own survey: objective and subjective dimensions are both important.” The decisions people take to shape their lives are determined as much by factual circumstances (objective) as by their perceptions of, and feelings about, those circumstances (subjective). Both must be measured to adequately represent the state and development of well-being.
3.38 Indicators are usually considered to be either objective or subjective. The adjectives ‘objective’ and ‘subjective’ refer to the substance of an indicator, not to how it is measured or the accuracy of the measurement (UNECE 2015; OECD 2011).
3.39 Subjective indicators measure how people perceive, emotionally experience or otherwise feel about an aspect of their life. Typical subjective indicators measure ‘satisfaction’ (e.g. job satisfaction, satisfaction with life), ‘experiences’ (e.g. finding it difficult to get by financially), and ‘feelings’ (e.g. feeling unsafe in a neighbourhood or uncertain about the future).
3.40 Objective indicators measure conditions, achievements and behaviours concerning an aspect of well-being for groups of people, independent of how people perceive their lives concerning that aspect. Typical examples are child mortality rates or the number of hospital beds per 1,000 population.
3.41 One needs to distinguish between the nature of the phenomenon and how information is collected. Subjective indicators are usually produced based on surveys. Objective indicators are often produced using administrative data (e.g. tax databases for household income) or sensor networks (e.g. air pollution), but they can also be collected in surveys through self-reporting (e.g. on income, technical deficiencies of a house, conditions of employment, or membership of associations). Box 3.3 illustrates the difference between measurement methods and the inherent nature of the indicators. Some indicators are clearly objective, others are clearly subjective, but the distinction is not always that clear in practice and measurement methods can blur the boundary.9
3.42 Where possible, the indicator set should include subjective as well as objective indicators in every dimension of well-being.
Box 3.3
Objective and subjective indicators and measurement methods
Objective and subjective indicators and measurement methods
|
Reporting method
|
|||
|
Administrative records, monitoring systems, and censuses
|
Surveys
|
||
|
Nature of the phenomenon
|
Objective
|
Urban population exposure to air pollution by particulate matter
|
Presence of specific defects in a house
|
|
Subjective
|
Sentiment10
|
Life satisfaction
|
|
3.3.4 Recommended indicators
3.43 Tables 3.1 – 3.10 presents recommended indicators for measuring well-being by dimension. For each indicator, the Annex provides more details regarding definitions, data sources and links to existing frameworks. The tables include general descriptions of ideal indicators. For example, a common indicator of material well-being is household income. Household income is a monetary value. This means that for monitoring developments over time, it must be expressed in constant prices of a reference year and for international comparisons, the values must be expressed in the same currency, preferably in purchasing power parities (PPPs). Also, the distribution of household income is skewed, which means that averages overestimate the level of income. Thus, the corresponding measure of the indicator will more likely be ‘median household income in purchasing power parity (PPP) dollars of a reference year’.
3.44 Indicators with the same name may be measured in different ways. As NSOs build their well-being frameworks, they will generally take a pragmatic approach, using what is available. The implication may be that such indicators are not internationally comparable.11 However, international harmonisation of well-being frameworks is the medium- to long-term goal of the statistical well-being agenda.
3.45 The names of indicators do not refer to specific groups, regions or other characteristics. Indicators can be disaggregated in several ways, for example by gender, age, education level, ethnicity, top and bottom of a distribution, as well as by region or neighbourhood. In some cases, such specifications can be meaningful. For example, indicators on sexual violence should be presented separately for women and men. Road fatalities could be measured specifically for young people, because this is the main cause of death among youths in some countries. Indicators can be broken down according to deprivation. It is also possible to include separate indicators on deprivation in the framework (see Boarini & d’Ercole, 2006 for a discussion of material deprivation indicators). Section 3.4 provides a more detailed discussion of the disaggregation of indicators.
3.46 Normalisation of indicators is standard practice. Data must be made comparable over time and between regions and nations. This is why monetary indicators are adjusted for inflation and currency differences, why numbers are expressed per capita, as a percentage of the population, as a percentage of GDP, per square kilometre, and so on. Where normalisation is essential, the type of normalisation should be included in the description of the indicator. Note that normalisation also hides absolute numbers (e.g. total CO2 emissions, the number of households living in poverty, the total shortage of houses), which are also essential for policy makers and could be presented concurrently or made available upon request.
3.47 The list of indicators specifies in which framework the indicators are already used (i.e. in OECD How’s Life?, in the Eurostat QoL Framework, and the CES Recommendations). The Handbook on Measuring Quality of Employment (UNECE 2015) and Principle 9 of the Fundamental Principles of Official Statistics recommend producing indicators based on international statistical guidelines and classifications. This helps to avoid duplication of effort, ensure consistency of indicators with international standards and facilitate identification of good practices for the development of new indicators (and dimensions) of well-being (UNECE 2015).
Dimension 1: Subjective well-being
3.48 Subjective well-being concerns the cognitive evaluation of a person’s life as a whole or aspects of it (satisfaction), eudaimonia, which relates to people’s sense of purpose and meaning, and affect (concerning feelings such as happiness, pain, worry, calm) experienced by the respondent at a particular point in time.
3.49 Relevant subdimensions: life satisfaction, eudaimonia, affect.
Table 3.1
Subjective well-being
Subjective well-being
|
nr.
|
indicator
|
use
|
type
|
|
1.1
|
Life satisfaction
|
O, E, C
|
subj
|
|
1.2
|
People who feel their life has meaning and purpose
|
O
|
subj
|
|
1.3
|
Negative affect balancea)
|
O
|
subj
|
Note: O = Used in OECD How’s Life? Well-being Dashboard or listed in OECD Guidelines on Measuring subjective well-being, E = Used in Eurostat QoL Framework, C = included in the CES Recommendations.
a) Ideally, the types of affect included in the indicator should be comparable across countries.
3.50 Relevant international statistical guidance includes the OECD Guidelines on Measuring Subjective Well-being (2013). These Guidelines are planned to be updated with revised recommendations for affect, eudaimonia and globally inclusive measures of subjective well-being in October 2025. The types of affect that are included in the OECD Guidelines on Measuring Subjective Well-being include feeling pain, happy, worried, calm, sad, angry, joyful, tired and stressed
Dimension 2: Material living conditions
3.51 Income shapes the consumption possibilities of households. Uncertainty about future material living conditions reflects a variety of risks with consequences for well-being.
3.52 Relevant subdimensions: income, economic insecurity.
Table 3.2
Material living conditions
Material living conditions
|
nr.
|
indicator
|
use
|
type
|
|
2.1
|
Household adjusted disposable income
|
O, E
|
obj
|
|
2.2
|
Relative income poverty
|
O, E
|
obj
|
|
2.3
|
Difficulty making ends meet
|
O, E
|
subj
|
|
2.4
|
Financial insecurity
|
O
|
obj/subj
|
Note: O = Used in OECD How’s Life? Well-being Dashboard, E = Used in the Eurostat QoL Framework, C = included in the CES Recommendations.
Dimension 3: Work and leisure
3.53 Work refers to productive activity (whether paid or unpaid), and work quality concerns the material and non-material aspects of people’s working conditions. Paid work can provide identity and a sense of meaning and purpose to people as well as opportunities to build strong social connections with others. Not all jobs are equally valuable in this respect, which is why job quality matters. Unpaid work is essential for sustaining daily life and includes activities such as cooking, shopping and caring for children and other household members. As with paid work, the conditions under which such unpaid work takes place influence the extent to which its impact on overall well-being is positive or negative.
3.54 Leisure time provides opportunities for activities of one’s choosing, which contributes to people’s health, satisfaction with life and social relationships. The quantity and quality of leisure time, including time allocated to leisure and personal care as well as participation in cultural events, contribute to well-being ‘here and now’. People’s self-assessment of the balance between work, care and leisure in their daily activities is also a determinant of overall subjective well-being.
3.55 Relevant subdimensions: paid work, unpaid work, leisure time.
Table 3.3
Work and leisure
Work and leisure
|
nr.
|
indicator
|
use
|
type
|
|
3.1
|
Labour force participation rate
|
O, C
|
obj
|
|
3.2
|
Unemployment
|
O, E
|
obj
|
|
3.3
|
Perceived job security
|
subj
|
|
|
3.4
|
Job satisfaction
|
O, E
|
subj
|
|
3.5
|
Long working hours a)
|
O
|
obj
|
|
3.6
|
Work injuries
|
obj
|
|
|
3.7
|
Leisure time b)
|
O, C
|
obj
|
|
3.8
|
Satisfaction with leisure time
|
O, E
|
subj
|
|
3.9
|
Informal care and household work
|
O, Ec)
|
obj
|
Note: O = OECD How’s Life? Well-being Dashboard, E = Eurostat QoL Framework, C = CES Recommendations.
a) In OECD How’s Life? “long hours in paid work” refers to the percentage of employees (aged 15+) whose usual working hours are 50 hours or more per week. The threshold is set at 50 hours because, after commuting, unpaid work and basic needs (such as sleeping and eating) are considered, workers routinely working more than 50 hours per week are left with few hours for other activities. Moreover, in countries where there is a regulation on maximum working time, this is generally limited to 48 hours per week.
b) Use terminology in line with the International Classification of Activities for Time-Use Statistics 2016 (ICATUS 2016) to promote harmonisation of measures of time-use, including time spent on unpaid work, leisure time, and volunteer work.
c) The Eurostat QoL-database contains data on “Time spent in total work (paid and unpaid work as main or secondary activity) by sex and by form of work”.
3.56 For more information on employment indicators, see the Handbook on measuring quality of employment (UNECE 2015). Recently, the UNSC endorsed the Guide to Producing Statistics on Time Use, which promotes the adoption of light instruments for collecting time-use data to facilitate more frequent measurement of unpaid domestic and care work. Many countries are embracing this approach by incorporating time-use modules into labour force or other household surveys, enabling more regular reporting on unpaid work as well as other objective and subjective measures on well-being.
Dimension 4: Housing
3.57 Housing provides shelter, safety, privacy and personal space. The area where people live also determines their access to many different services. Different aspects of housing conditions include the quality of housing, housing affordability (share of housing cost in household income) and the amenities and characteristics of neighbourhoods.
3.58 Relevant subdimensions: quantity, quality, affordability, neighbourhood.
Table 3.4
Housing
Housing
|
nr.
|
indicator
|
use
|
type
|
|
4.1
|
Satisfaction with housing
|
subj
|
|
|
4.2
|
Population living in a dwelling with major deficiencies
|
E, Ca)
|
obj
|
|
4.3
|
Overcrowding
|
O, E
|
obj
|
|
4.4
|
Housing affordability
|
O, C
|
obj
|
|
4.5
|
Housing cost overburden
|
O
|
obj
|
|
4.6
|
Satisfaction with own neighbourhood
|
subj
|
|
|
4.7
|
Energy poverty
|
O
|
obj
|
Note: O = OECD How’s Life? Well-being Dashboard, E = Eurostat QoL Framework, C = CES Recommendations.
a) Living without housing deprivation.
Dimension 5: Health
3.59 Health is about being and feeling well: a long life unencumbered by physical or mental illness, and the ability to participate in activities that people value. A life lived free of illness and disability has intrinsic value for people as well as instrumental value. It enhances people’s opportunities to participate in education, the labour market and community life.
3.60 Relevant subdimensions: physical health, mental health.
Table 3.5
Health
Health
|
nr.
|
indicator
|
use
|
type
|
|
5.1
|
Life expectancy
|
O, E, C
|
obj
|
|
5.2
|
Perceived health
|
O, E
|
subj
|
|
5.3
|
Overweight population
|
Oa), E
|
obj
|
|
5.4
|
Population with severe long-standing limitations due to health problems
|
E
|
obj
|
|
5.5
|
Deaths from suicide, acute alcohol abuse and drug overdose
|
O, C
|
obj
|
|
5.6
|
People who experience symptoms of anxiety or depression b)
|
O
|
subj
|
|
5.7
|
Avoidable (or premature) mortality
|
Oa)
|
obj
|
Note: O = OECD How’s Life? Well-being Dashboard, E = Eurostat QoL Framework, C = CES Recommendations.
a) Under human capital in the OECD Well-being Dashboard.
b) The guidance is on capturing the two most common mental health conditions (anxiety, depression). See OECD (2023), Measuring Population Mental Health.
Dimension 6: Knowledge and skills
3.61 Education provides the skills and competencies people need to function and adapt in society and the economy. Education is strongly associated with higher life satisfaction, better health status, higher income, lower unemployment, more social connections, and greater engagement in civic and political life.
3.62 Relevant subdimensions: education, skills.
Table 3.6
Knowledge and skills
Knowledge and skills
|
nr.
|
indicator
|
use
|
type
|
|
6.1
|
Secondary educational attainment
|
Oc), E, Ca)
|
obj
|
|
6.2
|
Youth not in employment, education or training
|
Od), E
|
obj
|
|
6.3
|
Lifelong learning
|
E, C
|
obj
|
|
6.4
|
Skills in reading
|
O, Eb)
|
obj
|
|
6.5
|
Skills in mathematics
|
Ob)
|
obj
|
|
6.6
|
Skills in science
|
O, C
|
obj
|
|
6.7
|
Digital skills
|
O, Eb)
|
obj
|
Note: O = OECD How’s Life? Well-being Dashboard, E = Eurostat QoL Framework, C = CES Recommendations.
a) Educational attainment, not distinguishing the level of education.
b) The CES Recommendations refer simply to ‘Competencies’.
c) Under human capital/ resources for future well-being in the OECD Well-being Framework.
d) Under work and job quality in the OECD Well-being Framework.
Dimension 7: Physical safety
3.63 Physical safety is about freedom from harm in the form of crime, conflict, violence, terrorism, oppression, accidents or natural disasters. Personal insecurity puts at risk the physical integrity of each person at risk. In extreme cases, these factors can lead to the death of the person involved.
3.64 Relevant subdimensions: feeling safe, crime, traffic accidents.
Table 3.7
Physical safety
Physical safety
|
nr.
|
indicator
|
use
|
type
|
|
7.1
|
Crime rate
|
obj
|
|
|
7.2
|
Victimization rate
|
E
|
sub
|
|
7.3
|
Homicide rate
|
O, E
|
obj
|
|
7.4
|
Sexual violence
|
obj
|
|
|
7.5
|
Feeling safe in the area where they live
|
O
|
subj
|
|
7.6
|
Road fatalities
|
O
|
obj
|
Note: O = OECD How’s Life? Well-being Dashboard, E = Eurostat QoL Framework, C = CES Recommendations.
3.65 The difference between 7.1 Crime rate and 7.2 Victimization rate is that the former is an objective indicator for the number of crimes (per 100,000 people) reported to the police, while the latter is a subjective indicator based on people’s own assessment of whether they have been victims of a crime. Certain types of crimes, for example, sexual violence, often go unreported, so the subjective measure is important to monitor.
3.66 Sexual violence is an example of an indicator where disaggregation (in this case by gender) would be relevant and recommended.
Dimension 8: Social connections
3.67 Social connections capture the quantity and quality of social interactions and the support provided by these connections. People derive intrinsic pleasure from spending time with others. People with extensive and supportive networks have better health, tend to live longer, report higher life satisfaction, and are more likely to be employed. Social isolation is the deprivation of social interactions (contact with family, friends, neighbours, colleagues).
3.68 Relevant subdimensions: social interactions, support, quality, community, trust.
Table 3.8
Social connections
Social connections
|
nr.
|
indicator
|
use
|
type
|
|
8.1
|
Frequency of social contacts
|
O, E, C
|
obj
|
|
8.2
|
Having someone to rely on
|
O
|
obj
|
|
8.3
|
Satisfaction with personal relationships
|
O, E
|
subj
|
|
8.4
|
Experience of discrimination
|
subj
|
|
|
8.5
|
Loneliness
|
O
|
subj
|
|
8.6
|
Trust in other people
|
Ob), a), C
|
subj
|
|
8.7
|
Participation in cultural activities
|
E
|
obj
|
|
8.8
|
Volunteering
|
Ob), C
|
obj
|
Note: O = OECD How’s Life? Well-being Dashboard, E = Eurostat QoL Framework, C = CES Recommendations.
a) Relevant international statistical guidance: OECD Guidelines on Measuring Trust (2017). OECD is developing guidelines for measuring social connections.
b) Under social capital/resources for future well-being in the OECD Well-being Framework.
3.69 Relevant international statistical guidance to consider includes the OECD Guidelines on Measuring Trust (2017). OECD is working on producing guidelines for measuring social connections.
Dimension 9: Civic engagement
3.70 Civic engagement is about whether people can and do take part in a range of important civic activities that enable them to shape the society they live in. It has intrinsic value to participate as full citizens, to have a say in the framing of policies, to dissent without fear and to speak up against what one perceives to be wrong. Civic engagement also has instrumental value for public policy and politics.
3.71 Relevant subdimensions: political voice, political participation.
Table 3.9
Civic engagement
Civic engagement
|
nr.
|
indicator
|
use
|
type
|
|
9.1
|
People who feel they have a say in what the government does
|
O
|
subj
|
|
9.2
|
Active citizenshipa)
|
E
|
obj
|
|
9.3
|
Voter turnout
|
O, E, C
|
obj
|
|
9.4
|
Trust in institutions
|
Ob), E
|
subj
|
Note: O = OECD How’s Life? Well-being Dashboard, E = Eurostat QoL Framework, C = CES Recommendations.
a) Eurostat defines active citizenship as “active citizens, meaning that they had attended meetings, signed petitions, or otherwise participated in activities related to political groups, associations or parties.”
b) Under social capital/resources for future well-being in the OECD Well-being Framework. Relevant international statistical guidance: OECD Guidelines on Measuring Trust (2017).
Dimension 10: Environmental conditions
3.72 Environmental quality affects human health through the quality of air, water and soil, which is related to the presence and density of hazardous substances and harmful environmental conditions such as extreme heat. It matters intrinsically to people who value natural beauty and the amenities that affect their life choices. People also benefit from environmental services and assets.
3.73 Relevant subdimensions: environmental quality, nature and biodiversity, extreme temperatures.
Table 3.10
Environmental conditions
Environmental conditions
|
nr.
|
indicator
|
use
|
type
|
|
10.1
|
Air quality a)
|
O, C
|
obj
|
|
10.2
|
Noise pollution
|
E
|
subj
|
|
10.3
|
Access to green space
|
O
|
obj
|
|
10.4
|
Exposure to extreme temperatures (heat stress)
|
O
|
obj
|
|
10.5
|
Clean drinking water
|
obj
|
Note: O = OECD How’s Life? Well-being Dashboard, E = Eurostat QoL Framework, C = CES Recommendations.
a) Relevant international statistical guidance: WHO Air quality guidelines (updated in 2021).
3.4 Distribution of well-being
3.74 In addition to focusing on the individual and household perspective, the existing frameworks consider it of high importance to measure distributions and identify inequalities in society (see also Chapter 2). Inequalities not only in income and wealth but also in health, education and subjective well-being and other areas inform about gaps among population groups or geographical areas and put a spotlight on deprived population groups (see Burger, J., and J. van Beuningen, 2020).
3.75 Measuring inequalities in income and wealth is one of the issues considered in the 2025 System of National Accounts to better reflect societal well-being. The 2025 SNA is also addressing other topics that may be of relevance in measuring well-being, such as unpaid household service work, health care, labour, education, and environmental-economic issues.
3.76 Also, Stiglitz, Sen and Fitoussi gave several key recommendations on the distribution of well-being:
•
Recommendation 4: Give more prominence to the distribution of income, consumption and wealth: averages are meaningful, medians provide a better measure of the typical individual or household, and for many purposes it is also important to know what is happening at the bottom or the top.
•
Recommendation 7: Quality-of-life indicators in all the dimensions covered should assess inequalities in a comprehensive way: Inequalities in quality of life should be assessed across people, socio-economic groups, gender and generations, with special attention to inequalities that have arisen more recently, such as those linked to immigration.
•
Recommendation 8: Surveys should be designed to assess the links between various quality-of-life domains for each person, and this information should be used when designing policies in various fields: ’joint distribution’ of the most salient features of quality of life across everyone in a country.
3.77 In addition to population averages, The OECD Well-being Framework and associated dashboard considers inequalities within groups, inequalities between groups, and deprivations. It distinguishes three types of inequality in the distribution of well-being (see OECD 2024):
•
gaps between population groups (horizontal inequalities);
•
gaps between those at the top and those at the bottom of the achievement scale in each dimension (vertical inequalities); and
•
deprivations (i.e. the share of the population falling below a given threshold of achievement).
3.78 NSOs are typically interested in differences between various population groups. Standard breakdowns are age, gender, education level, and income group. Other relevant ways to disaggregate an indicator include regional breakdowns, population density of the community (urban versus rural), indigenous status, ethnicity, household composition, and disability status. The results more precisely show where well-being is higher or lower.
3.79 Breakdowns are often associated with policy relevance or notions of causality. For example, it is known that health outcomes vary by age, that trust in institutions varies by education level, that people in urban areas experience more crime and lower social cohesion than in rural areas, and that labour participation and earnings vary by gender. Figure 3.1 shows an example from the Netherlands, namely average life satisfaction by gender, age group, education level, and country of origin and birth. Grey bars indicate that there is no statistically significant difference from the population average, red bars indicate numbers significantly lower than the average, and green bars indicate numbers significantly higher than the average.
3.80 Rather than selecting breakdowns based on policy relevance or causal models tailored to each indicator, it is recommended to monitor the distribution of well-being by disaggregating all or a sample of indicators (for example, one or two for each dimension) for the same population groups (e.g. age, gender, education level, and income group). This provides a more consistent picture of the overall well-being of each of these population groups and enables insights that may not be apparent.
3.81 A more advanced but technically more difficult analysis is to combine information on well-being outcomes in different dimensions on the individual level using microdata. This reveals how positive and negative well-being outcomes accumulate in different population groups.12 Another way to combine information is by looking at the joint distribution of indicators by different characteristics (for example, sex AND geographic region AND level of education), to identify the most disadvantaged population groups (see Istat 2024).
Figure 3.1
Satisfaction with life by sex, age, education level, and origin/country of birth in the Netherlands in 2023. The percentage of the population that scored life satisfaction at least 7 out of 10
Satisfaction with life by sex, age, education level, and origin/country of birth in the Netherlands in 2023. The percentage of the population that scored life satisfaction at least 7 out of 10
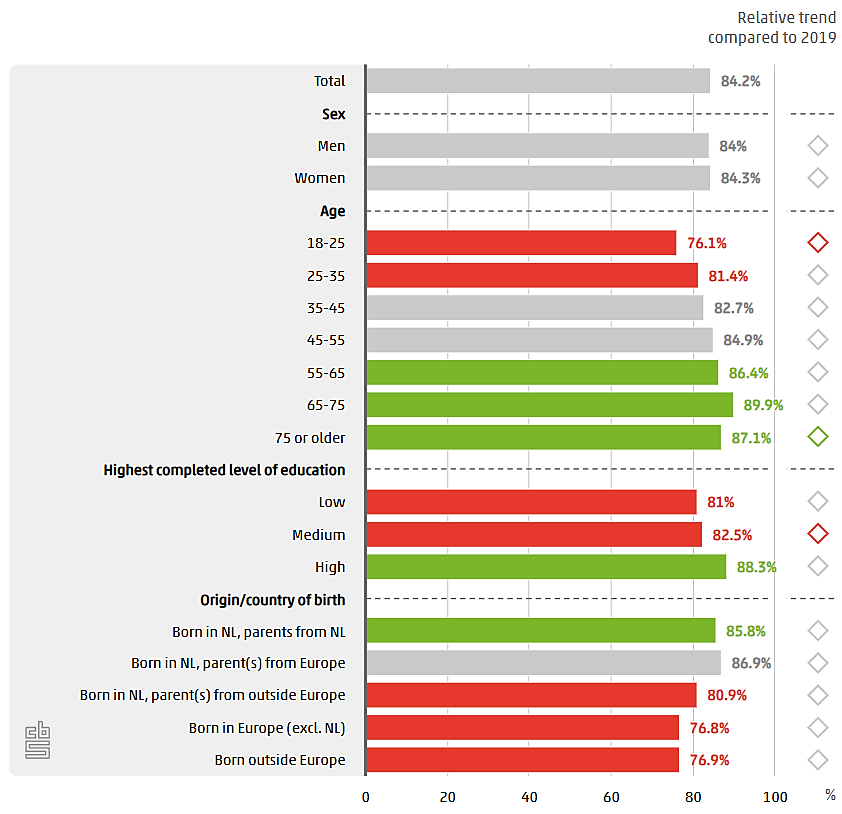
Source: Statistics Netherlands, Monitor Well-Being and the Sustainable Development Goals 2024.
3.82 The CES Recommendations (2014) recognize distributional indicators. In their presentation of the sustainable development indicators to the dimension of human well-being (‘here and now’), they distinguish them from aggregate indicators. The following distributional measures are adopted in their recommendations: 7. Income inequality, gender pay gap, 15. Distribution-health, 19. Female employment rate, 20. Youth employment rate and 27. Distribution education (see also page 70 of the CES recommendations, Table 8.1).
3.83 The Beyond GDP framework, as proposed in the UN Valuing What Counts report (p. 154) mentions reduced inequalities and greater solidarity towards a more equal distribution of well-being as one of three outcome elements derived from the Brundtland Report and the SDGs. The other two outcome elements are well-being and agency to focus on current well-being, and respect for life and the planet to ensure possibilities for life and well-being in the future. All three elements are directed to achieve greater solidarity, transformation, stronger governance and resilience, technology, innovation, and creativity to ensure well-being today, in the future and for everyone, underpinned by active, free and meaningful participation of people.
3.84 When applying and interpreting inequality measures, for example on poverty (see Box 3.4), one should be aware of implicit value judgements, such as ‘more happiness is better’ or the choice to treat all same-sized differences in well-being equally rather than penalizing increases in unhappiness.
Box 3.4
Subjective and objective measures for poverty
Subjective and objective measures for poverty
Objective poverty measures alone are not sufficient to understand the complexity of poverty. Subjective measures can complement them in important ways, especially with regard to reaching the poorest and making their voice heard. Applying a subjective approach allows for a better understanding of what poverty means to people, as well as to verify whether objective evaluations of poverty are consistent with the social perception of this phenomenon. Subjective measures also provide information on 'public moods', which can influence people's behaviour in both the economic, social and political spheres. In its final report, the UNECE task force on Subjective Poverty Measures (ECE/CES/2024/2) recommended two indicators of subjective poverty, one based on qualitative responses and the other on quantitative responses. The indicators are developed using two measures: (1) perceptions of a household’s financial well-being, and (2) perceptions of a household’s minimum resources to make ends meet.
Subjective measures can further add value in considering quantitative approaches to measuring poverty, which, rather than asking for a specific monetary value (levels of income, expenditures, consumption, or wealth), consider respondents’ perceptions about their (or a hypothetical household’s) material, financial, or economic situation. Statistical analyses related to the use of subjective and quasi-subjective measures may also be used to verify and even construct measures of an objective nature, for example, the consensus method for constructing deprivation indices, and verification of equivalence scales used.
3.85 Statistical data tend to focus on the working-age population, and there is a risk that children and elderly people are not sufficiently represented. When it comes to surveys to collect subjective indicators (on satisfaction, fears, worries, experiences), these may exclude children and elderly people, or the questions may be designed mainly to capture the sentiments of the working-age population. The broader issue is that specific indicators need to be developed to measure the well-being of the young and the old. Examples for the young include youth discomfort, relations with classmates, bullying, and Internet abuse. The inclusion of children in a well-being measurement framework is elaborated in Box 3.5. Examples for the elderly include the level of state pensions paid relative to the median wage, the level of provision of care and accommodation, and the level and quality of social care and geriatric health care.
Box 3.5
Children in well-being measurement frameworks
Children in well-being measurement frameworks
Many international and national well-being frameworks are conceptualized purely or primarily about the well-being of adults. This creates gaps at the conceptual and measurement levels.
Conceptually, many dimensions and indicators of well-being are equally relevant to adults and children. However, frameworks designed with adults in mind may not fully represent the issues most relevant to children’s well-being. For example, pressure at school, experiences of peer bullying, experiences of participation, and children’s individual experiences of material deprivation are well-established as important factors that affect children’s well-being. The OECD Child Well-being Dashboard contains a range of child-specific indicators that may be considered to fill this gap. The UK national well-being framework includes a list of child-specific indicators.
At the measurement level, gaps can occur not because there is a need for a different measure for children but simply because there aren’t currently mechanisms in place to include children. This is true for many of the subjective indicators recommended in this chapter. It is well-established that children above a certain age (variable depending on the question) can answer questions about their subjective well-being. The problem is that the surveys used to gather this data often only include adults.
Due to such omissions, well-being conversation becomes one about adult well-being. For example, the World Happiness Report focuses primarily on life satisfaction based on surveys of people aged 15 and above. It is an underlying assumption of developing national well-being frameworks that they may be used to inform national policy to improve people’s lives. So, if groups of the population are excluded, their views and experiences will not inform policy. This includes a risk that the policy becomes more adult-centric and neglects children’s well-being.
For these reasons, it is essential that well-being frameworks that are intended to represent the whole population include children. This may require adaptations to existing surveys (for example, the Understanding Society survey in the UK is an annual household survey which includes an individual self-completion questionnaire for children aged 10 to 15 in the household). It may also require new survey initiatives, such as school-based surveys, to gather data.
In conclusion, when countries are developing and implementing measures of national well-being, it will be important to consider how to include existing data relevant to children’s well-being and also to consider what additional data may be needed in the long term to develop an overview of this age group that can inform policy.