

Chapter 8 Costs
 8.1 Introduction
177.
177. Population censuses are the largest statistical operation undertaken in the context of any official statistical system. They are also – at least as far as censuses based on field enumeration are concerned – the most expensive one, and since census expenses are usually concentrated during a short period of time, census costs may appear to be greater than if they were spread evenly over a decennial period.
178.
178. Over the last years, the increasing use of registers and administrative data and many innovations in census methodology and technology contributed to contain or even reduce the census costs. Those innovations include, in particular, developments in geographic information systems, internet data collection, tablets and other devices for field collection and data visualization of outputs.
179.
179. On the other hand, in most countries there continues to be a growing need for better and more intensive census publicity to increase the chances of a successful census and this has brought an added and growing item to census costs.
180.
180. Managing census costs is an important aspect of the organization of any census. Consequently, the UNECE survey paid attention to learning about the level and profile of national costs and the period of time the cost was incurred. This section presents the results of the survey, separately for the three census methods as they have a strong impact on the structure of census costs.
181.
181. Before presenting the results, attention should be drawn to the fact that the analysis of data on census costs should be considered with some caution. The comparison of census costs across countries is affected by many factors. One of them is the complexity of comparing costs across currencies and different points in time (the reported censuses across the region were conducted over a timeframe of five years, during the period 2019-2024). A further important factor arises from the difficulties of categorizing census expenses across countries (and different census methods) in a standard way to allow meaningful comparisons.
182.
182. The main goal of the present analysis is to describe only the broad experiences of the reporting countries. Accordingly, whilst broad comparisons can be made, detailed comparisons between particular countries should be made only with caution.
8.2 Total and per capita census costs
183.
183. The estimated total cost of the census reported by the UNECE countries – based on the census lifecycle – and the per capita cost in United States dollars are presented in Table 32. For many countries the estimates were reported when the census operations were not completed yet, so in general they should be considered as provisional estimates.
184.
184. The estimated cost reported by the United States for the 2020 census (13.6 billion dollars, about 10% more than the 2010 census of the United States) is by far the highest among the reporting countries, concerning both the total and the per capita cost, although it does not include the American Community Survey that replaced the census long form.
185.
185. The lowest costs are reported by countries with register-based censuses as they do not conduct any expensive field operations. Excluding Austria, whose estimated cost is 10 million euros, in all other countries with a register-based census the cost is relatively low, 3.2 million euros or lower. In four of those countries the cost was less than one million euros. This is possible when the census is based on statistical data that are produced normally by the register-based statistical system, with no or marginal additional costs. As an example, Norway specified that the estimated cost (400,000 euros) includes mainly additional costs to comply with the EU regulation and to deliver data to UNSD.
186.
186. The costs reported by countries with register-based census do not include the initial costs of developing the register-based statistical system (except for the first census based on registers). Slovenia specified that the costs of developing the methodologies, procedures and tools in their previous register-based censuses, which were reused in the 2020 round, are not included in the very low estimate reported (270,000 euros). For reference, the first fully register-based census in Slovenia in 2011 took about 20,000 working hours whereas the 2021 census was estimated to take about 10,000 working hours.
187.
187. A general comparison of the census costs between countries and methodologies is based on the per capita costs for countries and the median value of the per capita cost for the three main census methods. The register-based census has by far the lowest per capita costs, ranging from 0.02 to 3.29 United States dollars. The median value of 0.18 dollars is slightly higher than the 0.24 dollars in the 2010 round. The per capita costs of field enumeration censuses are significantly higher, ranging from 1.88 to 41.03 dollars, with a median value of 6.08 dollars slightly higher than the 5.84 dollars in the 2010 round. For combined censuses, the per capita costs range from 0.60 to 21.40 dollars and the median value is 6.04 dollars. This is only slightly lower compared to field enumeration censuses in the 2020 round and 53% higher compared to combined censuses in the 2010 round.
188.
188. The last column of the table presents the per capita costs converted into purchasing power parity (PPP) units. This measure provides an internationally comparable estimate of costs. It is based on the purchasing power in the different countries standardized into one common measuring unit.
Table 32
Estimated total and per capita census cost
Estimated total and per capita census cost
|
Census cost (in 2021 US dollars)
|
|||
|
Type of census / Country
|
Total cost
|
Per capita
|
Per capita (PPP)
|
|
Field enumeration census
|
median 251 635 000
|
median 6.08
|
median 10.56
|
|
Portugal
|
43 070 000
|
4.16
|
6.51
|
|
Azerbaijan
|
18 700 862
|
1.88
|
6.99
|
|
Bulgaria
|
21 719 679
|
3.33
|
7.95
|
|
France
|
460 200 000
|
7.03
|
8.44
|
|
Russian Federation
|
497 000 000
|
3.37
|
10.47
|
|
Croatia
|
19 873 376
|
5.13
|
10.66
|
|
United Kingdom
|
991 200 000
|
15.64
|
17.00
|
|
Canada
|
606 195 137
|
16.39
|
17.66
|
|
Albania
|
19 942 000
|
8.30
|
20.88
|
|
United States of America1
|
13 600 000 000
|
41.03
|
41.03
|
|
Combined census
|
median 72 267 920
|
median 6.04
|
median 7.76
|
|
Switzerland2
|
7 103 600
|
0.75
|
0.65
|
|
North Macedonia
|
10 030 000
|
0.60
|
1.75
|
|
Poland
|
72 267 920
|
1.90
|
4.19
|
|
Italy
|
192 045 000
|
3.25
|
4.40
|
|
Armenia
|
3 600 000
|
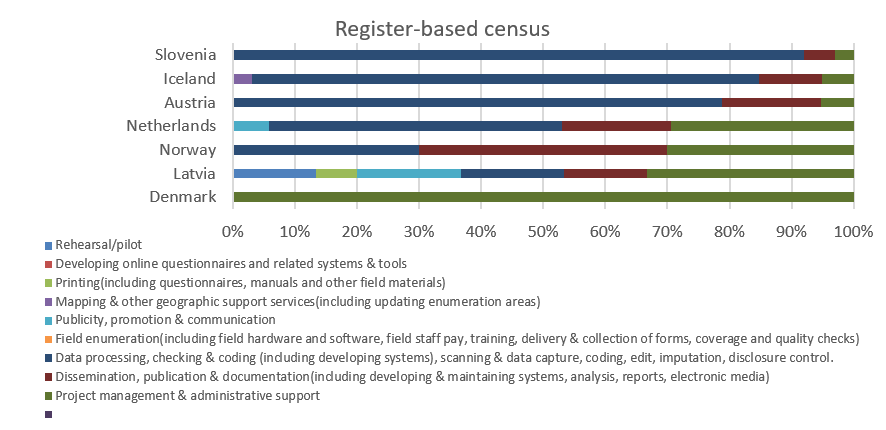
1.34
|
4.55
|
|
Israel
|
75 000 000
|
7.81
|
6.90
|
|
Cyprus
|
4 956 000
|
5.37
|
7.76
|
|
Serbia
|
40 120 000
|
6.04
|
14.59
|
|
Czechia
|
90 800 278
|
8.63
|
14.89
|
|
Hungary
|
88 500 000
|
9.22
|
18.83
|
|
Ireland
|
84 370 000
|
17.72
|
19.92
|
|
Republic of Moldova
|
20 232 083
|
7.21
|
21.44
|
|
Germany
|
1 770 000 000
|
21.40
|
25.60
|
|
Register-based census
|
median 2 242 000
|
median 0.18
|
median 0.24
|
|
Denmark
|
118 000
|
0.02
|
0.02
|
|
Norway3
|
472 000
|
0.09
|
0.09
|
|
Sweden
|
885 000
|
0.09
|
0.10
|
|
Spain
|
3 776 000
|
0.08
|
0.11
|
|
Netherlands (Kingdom of the)
|
2 950 000
|
0.18
|
0.20
|
|
Slovenia
|
318 600
|
0.15
|
0.24
|
|
Finland
|
2 596 000
|
0.47
|
0.50
|
|
Lithuania
|
2 242 000
|
0.80
|
1.53
|
|
Austria
|
11 800 000
|
1.32
|
1.54
|
|
Iceland
|
1 180 000
|
3.29
|
2.93
|
|
Latvia
|
3 068 000
|
1.62
|
2.95
|
1 United States of America: The cost does not include the American Community Survey.
2 Switzerland: The cost of registers (maintenance etc.) is not included.
3 Norway: Mainly additional cost to comply to the EU regulation and delivering of data to UNSD.
8.3 Elements of census costs
Figure 4
Elements of census costs by category of work
Elements of census costs by category of work


190.
190. For field enumeration and combined censuses (first two panes in the figure), countries are sorted by the percentage of the cost category which is normally the highest for those census methods, that is field enumeration, which includes field hardware and software, field staff pay, training, delivery and collection of forms, coverage and quality checks.
191.
191. For field enumeration censuses, the cost of field enumeration accounts for half or more of the total cost, up to 78% in Azerbaijan and 84% in Portugal. In the United Kingdom, field enumeration accounts for only 27% of the total cost, while rehearsal/pilot is the first cost category, accounting for 35%.
192.
192. Also for combined censuses, field enumeration is the highest cost category for most countries, reaching 85% of the total cost in Serbia and 84% in Italy. In a few countries, field enumeration was limited and less expensive. In Switzerland it accounted for 13% of the total cost (32% was spent for dissemination, publication and documentation) and in Poland for 34% (43% was spent for project management and administrative support).
193.
193. For register-based censuses where there is no field enumeration, the highest cost category in the majority of countries is data processing, checking and coding (including developing data processing systems, scanning and data capture, edit, imputation and disclosure control), which accounts for 92% of the total cost in Slovenia, 80% in Iceland and 74% in Austria. In Denmark, where the total cost of the census was the lowest (100,000 euros), no cost was reported for data processing, checking and coding, and 95% of the cost was for staff costs and some census-related operations, reported in the category “other costs”. Similarly, in Latvia 70% of the cost was to comply to EU regulation and for data delivery to the UNSD, reported under “other costs”. Norway reported 40% of the cost for dissemination, publication and documentation; 30% for data processing, checking and coding; and 30% for project management and administrative support.