UNECE Data Portal
Bringing statistical data closer to you


METHODOLOGY | Economy
Ottawa Group on Price Indices
UNECE is now hosting the website of the Ottawa Group on Price Indices, a UN city group established to develop methods and good practices for measuring inflation.
The website gives access to papers from 1994 onwards on research, methods and practices in compiling consumer price indices.
Published 28-03-2024

PUBLICATIONS | SDG
Sustainable Development in the UNECE Region: Facing a Headwind in 2024
This publication provides the 2024 progress assessment on the Sustainable Development Goals (SDGs) in the region of the United Nations Economic Commission for Europe (UNECE), based on the data available in the United Nations Global SDG Indicators Database.
Published 23-02-2024

METHODOLOGY | Economy
Inventory of Thematic and Extended Accounts
UNECE has released a new website with detailed inventory of Thematic and Extended Accounts. This new resource offers comprehensive insights into the economic accounts published by countries worldwide that expand on the classical measures included in core national accounts.
Published 24-01-2024

STORIES | Transport
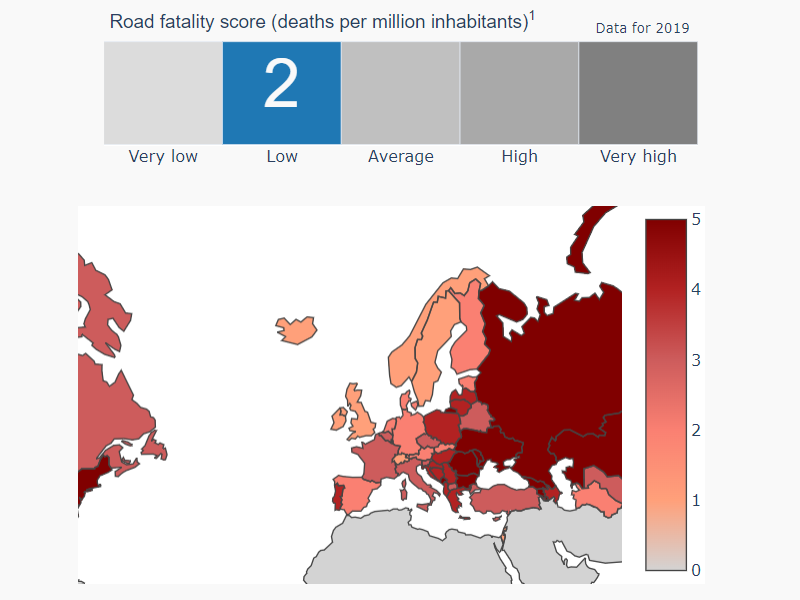
Road safety in the UNECE region. What do the data say?
The original SDG target 3.6 aimed to halve road fatalities in the decade to 2020. Explore how things have progressed in the ECE region, see trends by country, road user and sex, and see what solutions UNECE proposes.
Published 01-07-2022

 support.stat@un.org